
Descripción
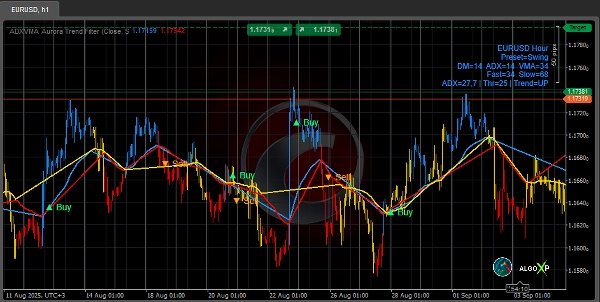
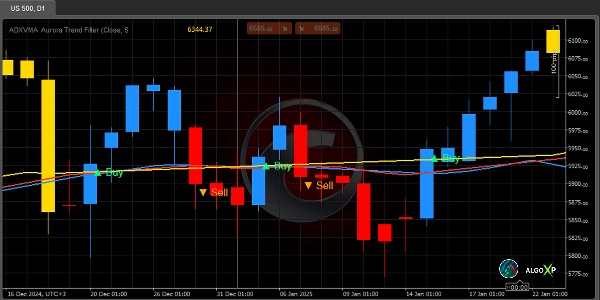
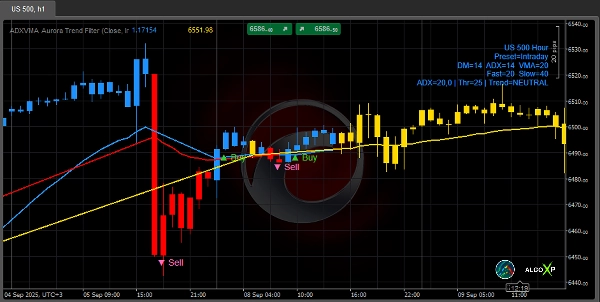
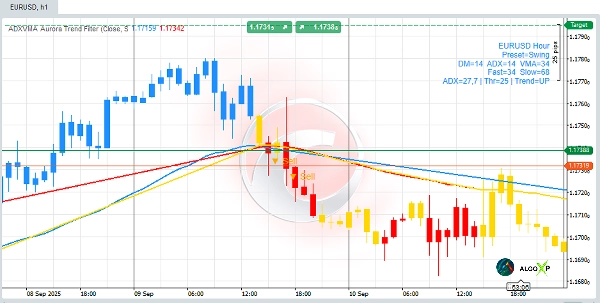
⚡ Filtro de Tendencia ADXVMA Aurora combina la fuerza de la tendencia ADX con una mezcla adaptativa de EMA para formar una línea base de trading confiable. A diferencia de los indicadores ordinarios con suavizado fijo, Aurora se ajusta en tiempo real—más cerca del precio en tendencias fuertes, más suave en rangos—y muestra un sesgo claro Alza / Baja / Neutral con flechas de cruce opcionales. El resultado es más capacidad de respuesta que las MAs estáticas y más estabilidad que solo el ADX.
🆚 Por qué es más fuerte que los indicadores ordinarios
- Contra MAs fijas: el coeficiente adaptativo reduce el retraso en tendencias y filtra el ruido en rangos.
- Contra ADX puro: convierte la fuerza en una línea base comerciable (con colores y señales de cruce), no solo un número.
- Contra filtros genéricos: una EMA rápida/lenta ponderada por ADX ofrece una mezcla equilibrada de sensibilidad y estabilidad.
🧠 El motor: mezcla de EMA ponderada por ADX
ADX (0…100) mide la fuerza de la tendencia. Aurora mezcla una EMA rápida y una EMA lenta, usando ADX como peso:
- ADX alto → sesgo hacia rápida (menor retraso).
- ADX bajo → sesgo hacia lenta (mejor filtrado de ruido).
La línea está codificada por color según la pendiente (y puede mostrarse Neutral cuando el ADX es débil), produciendo una lectura clara Azul / Rojo / Amarillo.
🔭 Qué hace
- Línea base adaptativa: mezcla EMA rápida y lenta usando ADX como peso.
- Colores de tres estados: Azul (Alza), Rojo (Baja), Amarillo (Neutral).
- Barras de color: coloreado de velas para contexto instantáneo.
- Flechas de cruce: modos Por Tendencia (Clásico) o Todos los Cruces (Simple).
- Panel de control: períodos en vivo, ADX y estado de tendencia.
- Listo para bots: serie oculta TrendState (−1/0/+1) y ADX para cBots/escáneres.
🎯 Cómo operarlo
- Sesgo: Línea arriba + azul → enfoque en largos; línea abajo + rojo → enfoque en cortos; amarillo → mantenerse al margen.
- Entrada: tomar la flecha cuando el precio cruza la línea base (elegir Por Tendencia o Todos los Cruces).
- Salida: detener en línea Aurora ± margen; tomar ganancias con RR≥2 o en cruce/oposición de color.
🚀 Preajustes (inicio rápido)
- Scalp: VMA=12 · ADX=14 · Umbral ADX=28 · Pendiente Neutral=0.04 · Enlace=VMA→2×VMA
- Intradiario: VMA=20 · ADX=14 · Umbral ADX=25 · Pendiente Neutral=0.06 · Enlace=VMA→2×VMA
- Swing: VMA=34 · ADX=14 · Umbral ADX=23 · Pendiente Neutral=0.10 · Enlace=VMA→2×VMA
- Posición: VMA=55 · ADX=14 · Umbral ADX=20 · Pendiente Neutral=0.15 · Enlace=VMA→2×VMA
🔧 Parámetros clave
- Períodos DM / ADX / VMA (separados, estilo Wilder).
- Usar DM genuino (Wilder): +DM/−DM estrictos (recomendado Activado).
- Enlace Adaptativo: Enlace a VMA (Rápida=VMA, Lenta≈2×VMA) o Manual Rápida/Lenta.
- Pendiente Neutral (pips): sensibilidad de pendiente por barra.
- Plano si ADX < Umbral: forzar Neutral durante tendencia débil (Activado/Desactivado).
- Flechas / Barras de color / Panel: encendido/apagado; Modo de Flechas: Por Tendencia / Todos los Cruces.
🎯 Perfecto para:
- Scalpers, traders intradiarios y swing que desean un filtro de tendencia claro + disparadores simples
- Traders algorítmicos que necesitan series estables y legibles por máquina.
🧭 Consejos de marco temporal y mercado
- TFs bajos (M1–M5): más ruido → comenzar con VMA 10–14, Pendiente Neutral 0.04–0.08, Umbral ADX 25–30.
- Intradiario (M15–H1): VMA 18–24, Pendiente Neutral 0.06–0.12, Umbral ADX 22–28.
- TFs altos (H4–D1): VMA 30–60, Pendiente Neutral 0.10–0.25, Umbral ADX 20–25.
- Principales vs. Volátiles (XAU, Cripto): aumentar VMA / Pendiente Neutral / Umbral un nivel para mercados volátiles.
Resumen
The core mechanism uses ADX (0–100) to weight a fast and slow EMA: high ADX values favor the fast EMA for responsiveness, while low ADX values favor the slow EMA for stability. This approach delivers more responsiveness than static moving averages and greater stability than ADX alone.
Key features include candle color bars for instant trend context, a dashboard showing live periods and trend states, and hidden series outputs (TrendState and ADX) suitable for algorithmic trading and scanners. It supports multiple preset configurations for scalping, intraday, swing, and position trading, with adjustable parameters for trend detection sensitivity and noise filtering.
The indicator is applicable across various markets including Forex, indices, commodities, stocks, and cryptocurrencies, and is designed for use on multiple timeframes from one minute to daily charts. It is suitable for traders seeking a clear trend filter with simple triggers and for algo traders requiring stable, machine-readable signals.
Valoraciones de clientes
5 | 33 % | |
4 | 67 % | |
3 | 0 % | |
2 | 0 % | |
1 | 0 % |


![Logotipo de "High-Low Divergence [Iridio Capital]"](https://cdn.ctrader.com/image/webp/443c4661-7abb-40f1-842f-4b6ec560649b_40914)


