
FractalArrowBuySell
Indicador
13 compras
Versión 1.0, Jun 2025
Windows, Mac
4.3
Valoraciones: 3
Descripción
El Indicador de Compra y Venta Fractal Arrow está señalando el enfoque correcto en el mercado. Minimiza las señales falsas en la entrada y salida.
Las últimas 7 de 10 copias se venderán a 20. El precio original será 39.
🖼️ ¿Por qué es muy importante usar esto?:
Resumen
Resumen de IA
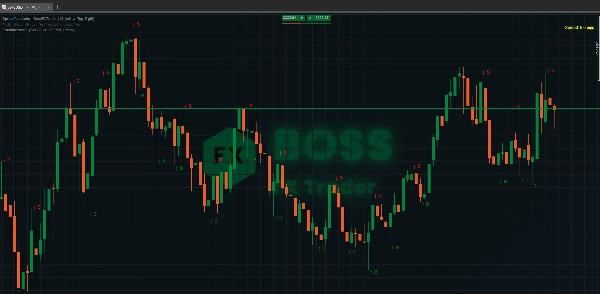
Fractal Arrow Buy and Sell Indicator provides visual signals for market entry and exit by displaying arrows and labels on price charts. It aims to reduce false signals through adjustable parameters including fractal period, arrow size, arrow offset label, and arrow color. The indicator marks buy signals with a green upward arrow below the candle accompanied by a green "B," and sell signals with a red downward arrow above the candle plus a red "S" slightly to the right.
The indicator supports multiple timeframes with recommended fractal settings and gain targets:
- 3-5 minutes timeframe: fractal set to 2, target gain 60-120 pips
- 15 minutes timeframe: fractal set to 5, target gain 300-500 pips
- 30 minutes timeframe: fractal set to 8, target gain 600-700 pips
Users can edit the instance name for easier identification. The indicator is designed to assist traders in identifying optimal buy and sell points by leveraging fractal analysis and customizable visual cues.
Perfil del indicador
Valoraciones de clientes
4.3
Valoraciones: 3
5 | 33 % | |
4 | 67 % | |
3 | 0 % | |
2 | 0 % | |
1 | 0 % |
Valoraciones de clientes
June 28, 2025
Useful when measured around swing point analysis. The useful part is reviewing reversals, pullbacks and swing zones, with the numbers checked before scaling. I would test 20 swing signals and ignore setups where the stop is wider than the 1.5R target. The level is useful when it supports the market story.
June 27, 2025
June 27, 2025
Cleaner way to review if the trader wants it helps identify turning points and cleaner structure. It works best as support, not a final decision maker. Swing points look better after 3 pivots, especially when the 0.5 Fib area agrees with structure. the signal still needs broader context.
Conversación
Preguntas frecuentes
Signal
Los productos disponibles a través de cTrader Store, incluidos bots, indicadores y plugins para operar, son proporcionados por desarrolladores de terceros y están disponibles únicamente con fines informativos y de acceso técnico. cTrader Store no es un bróker, por lo que no proporciona asesoramiento de inversión, recomendaciones personales ni ninguna garantía de rentabilidad futura.
Más de este autor


Precio
Desde 29/05/2025
3.04M
Volumen operado
45.22K
Pips ganados
29
Ventas
771
Instalaciones gratis