

Descripción
1️⃣ ¿Qué hace este indicador?
Esta herramienta resume la dirección de las velas en múltiples marcos temporales en un solo lugar en tu gráfico.
Para cada marco temporal, verifica la última vela cerrada y muestra:
EstadoSignificado
🟢 Alcista
Cierre > Apertura (compradores en control)
🔴 Bajista
Cierre < Apertura (vendedores en control)
⚪ Doji
Cierre ≈ Apertura (indecisión)
Marcos temporales mostrados:
- Diario
- H4
- H1
- M30
- M15
- M5
Todos los estados se muestran en el mismo gráfico, por lo que no necesitas cambiar de marco temporal.
2️⃣ Por qué esta herramienta es poderosa
🔥 Resuelve un problema común de los traders
La mayoría de los traders preguntan:
“¿Estoy operando a favor o en contra de la tendencia del marco temporal superior?”
Este indicador responde eso al instante.
En lugar de adivinar:
- Ves la alineación de la tendencia
- Evitas entradas contrarias a la tendencia
- Mejoras el momento y la confianza
3️⃣ Cómo funciona el indicador
📌 Lógica del estado de la vela
- Usa la última vela cerrada (
Last(1)) - No repinta
- Confirmación confiable
📌 Datos multi-marco temporal
- Obtiene datos reales de velas de cada marco temporal
- Independiente del marco temporal del gráfico en el que estés
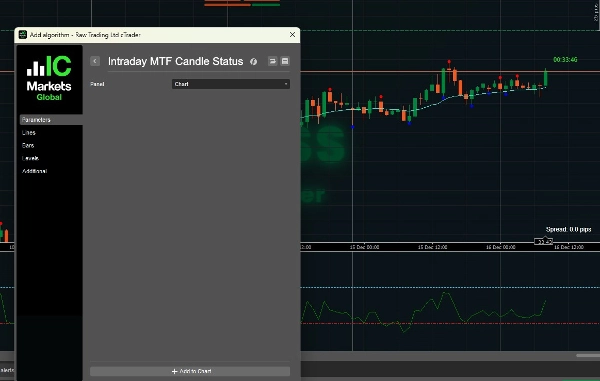
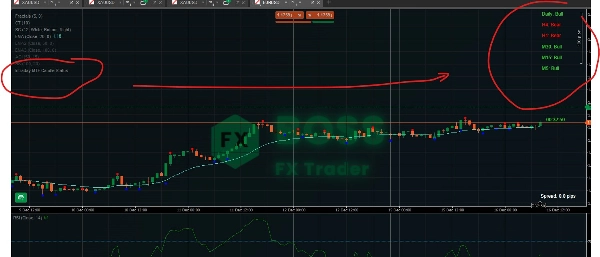
📌 Visualización en el gráfico
- Dibuja etiquetas de texto en la parte superior derecha
- Codificado por colores para lectura instantánea
- Actualizado en cada tick
4️⃣ Cómo usarlo efectivamente (escenarios de trading)
🟢 Escenario 1: Confirmación de tendencia (mejor caso de uso)
✔ Regla:
Opera solo cuando los marcos temporales superiores e inferiores estén de acuerdo
Ejemplo:
Diario: Alcista
H4: Alcista
H1: Alcista
M15: Alcista
M5: Alcista
✅ Ambiente de COMPRA de alta probabilidad
Usa:
- Retrocesos
- Rupturas
- Entradas de continuación
❌ Evita VENTAS aquí
🔴 Escenario 2: Advertencia de contra-tendencia
Diario: Alcista
H4: Alcista
H1: Bajista
M15: Bajista
M5: Bajista
⚠️ El mercado está en un retroceso, no en una reversión.
Mejores acciones:
- Espera a que M5/M15 vuelvan a ser alcistas
- Evita perseguir VENTAS
- Busca configuraciones de compra en soporte
⚪ Escenario 3: Mercado lateral / entre rangos
Diario: Alcista
H4: Doji
H1: Doji
M15: Bajista
M5: Alcista
🚫 Condiciones de baja calidad
Recomendado:
- Reduce el tamaño de la posición
- Evita operaciones de ruptura
- Espera claridad en la estructura
5️⃣ Ejemplo de estrategia de scalping (entradas M5)
🔹 Configuración ideal de compra
- Diario → Alcista
- H4 → Alcista
- H1 → Alcista
- M15 → Alcista
- M5 → Bajista → cambia a Alcista
📍 Entrada:
- Cuando M5 vuelva a ser alcista
- Combina con:
-
- Soporte
- Fractales
- EMA / VWAP
🔹 Configuración ideal de venta
Lógica opuesta:
- TF superiores → Bajista
- Entra en la finalización del retroceso en M5
6️⃣ Mejores combinaciones de marcos temporales
Estilo de tradingMarcos temporales de enfoque
Scalping
H1 → M15 → M5
Intradiario
H4 → H1 → M15
Swing
Diario → H4 → H1
7️⃣ Qué NO es esta herramienta
🚫 No es una señal de entrada por sí sola
🚫 No es un indicador de reversión
🚫 No reemplaza la estructura / acción del precio
✅ Es una herramienta de sesgo y confirmación
8️⃣ Mejores indicadores para combinar
Combinaciones altamente recomendadas:
- ✅ Fractales (ya los usas)
- ✅ Estructura del mercado (HH / LL)
- ✅ Soporte y resistencia
- ✅ EMA 50 / EMA 200
- ✅ VWAP
9️⃣ Reglas profesionales de trading usando esta herramienta
✔ Opera solo en la dirección del HTF
✔ Usa el LTF solo para timing de entrada
✔ Ignora señales cuando Diario y H4 no coinciden
✔ No sobreoperes durante señales mixtas
✔ Deja que la estructura confirme el sesgo de la vela
🔟 Resumen final
IntradyMultiTimeframeCandleStatus = Panel de sesgo del mercado
Te ofrece:
- Claridad instantánea de la tendencia
- Operaciones con mayor probabilidad
- Decisiones menos emocionales
- Ejecución más limpia
Consulta nuestro producto.
Resumen
Valoraciones de clientes
5 | 100 % | |
4 | 0 % | |
3 | 0 % | |
2 | 0 % | |
1 | 0 % |


