

Opis
Kalkulator spreadu to narzędzie służące do obliczania różnicy między dwiema cenami lub wartościami, często używane w kontekstach finansowych podczas handlu. Może pomóc określić potencjalne zyski, straty i punkty rentowności, a także oszacować uczciwe kursy i linie w scenariuszach handlowych.
Dlaczego warto używać tego wskaźnika?
- Handluj z precyzją: Dokładnie poznaj aktualny spread każdej pary walutowej lub akcji.
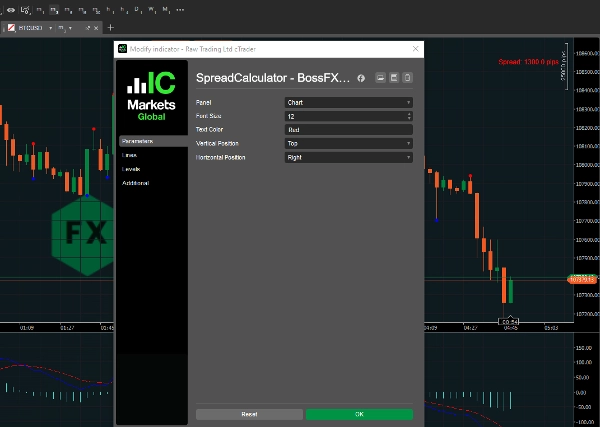
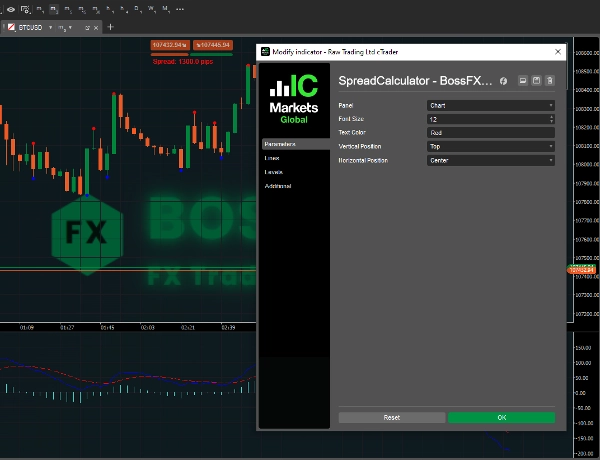
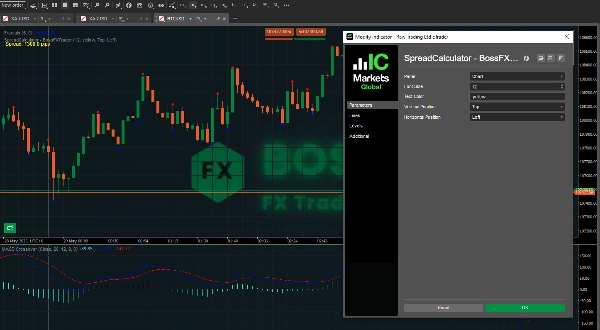
- Kontrolowane tryby pozycji: Rozmiar czcionki, kolor tekstu, pozycja pionowa i pozioma.
Oto dlaczego korzystanie z kalkulatora spreadu jest korzystne:
- Zrozumienie kosztów handlu:
Spread jest podstawowym kosztem handlu, a kalkulator pomaga wizualizować ten koszt podczas otwierania lub zamykania transakcji.
- Optymalizacja strategii:
Analizując historyczne spready, możesz optymalizować swoje strategie handlowe i zmniejszać ogólne koszty handlu.
- Podejmowanie świadomych decyzji:
Kalkulator dostarcza danych o spreadzie, pozwalając podejmować świadome i przygotowane decyzje handlowe.
- Obliczanie wymagań dotyczących depozytu zabezpieczającego:
W zakładach spreadowych kalkulator spreadu może pomóc określić wymaganą marżę dla Twojej transakcji, czyli kwotę kapitału, którą musisz mieć na koncie.
- Ocena potencjalnego zysku/straty:
Kalkulator może również oszacować Twój potencjalny zysk lub stratę na podstawie aktualnego spreadu i wielkości transakcji.
- Porównywanie brokerów:
Możesz użyć kalkulatora spreadu, aby porównać spready oferowane przez różnych brokerów i wybrać tego, który zapewnia najlepsze stawki dla Twoich potrzeb handlowych.
- Analiza strategii opcyjnych:
W handlu opcjami kalkulatory spreadu mogą pomóc analizować różne strategie spreadów pionowych (takie jak spread byka/niedźwiedzia).
- Zrozumienie cen kupna i sprzedaży:
Spread to różnica między ceną kupna (ceną, za którą sprzedający chce sprzedać) a ceną sprzedaży (ceną, za którą kupujący jest gotów kupić).
Podsumowanie
Opinie klientów
5 | 50 % | |
4 | 50 % | |
3 | 0 % | |
2 | 0 % | |
1 | 0 % |


