
Opis
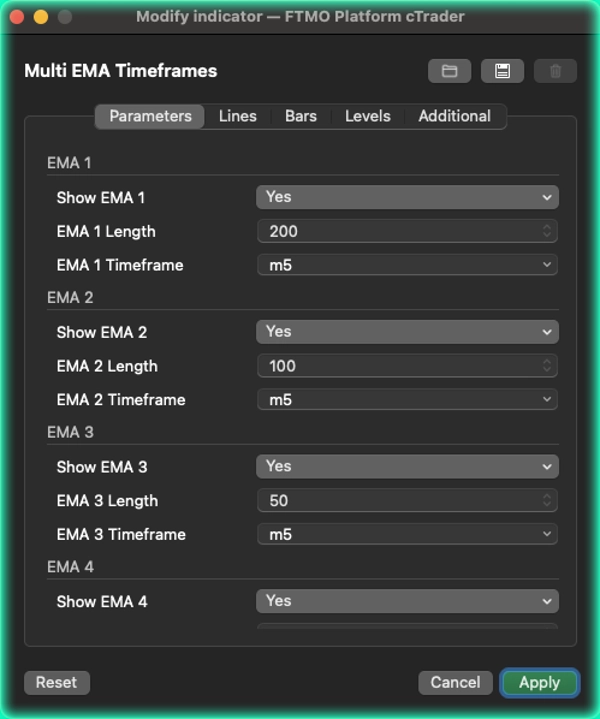
Multi EMA Timeframes by [BeyondTrading] Najczęstszym błędem popełnianym przez traderów przy korzystaniu ze średnich kroczących jest zmienianie interwałów czasowych tylko po to, by sprawdzić, gdzie znajduje się kluczowa EMA. Multi EMA Timeframes całkowicie eliminuje ten problem. Pozostajesz na swoim roboczym interwale — 5-minutowym, 15-minutowym, 1-godzinnym — i dokładnie definiujesz, która EMA z którego interwału powinna pojawić się na twoim wykresie, właśnie teraz, bez przechodzenia gdziekolwiek indziej.
Jesteś na wykresie 5-minutowym i chcesz zobaczyć 200 EMA z interwału godzinowego? Gotowe. Chcesz też mieć 50 EMA z 15-minutowego i 20 EMA z bieżącego interwału obok siebie? Również gotowe. Każda z pięciu EMA jest konfigurowana całkowicie niezależnie: własny okres, własny interwał źródłowy, własny kolor i własny przełącznik włącz/wyłącz.
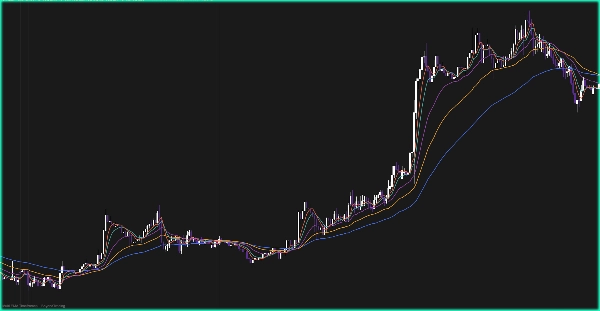
Jest to szczególnie potężne w setupach konfluencyjnych. Gdy cena na twoim interwale wejściowym zbliża się do EMA należącej do znacznie wyższego interwału, ten poziom ma realną wagę strukturalną. Widzenie go bezpośrednio na wykresie — bez przełączania zakładek, bez zgadywania dokładnej wartości — zmienia sposób, w jaki wchodzisz w interakcję z tymi kluczowymi strefami.
Dwa tryby renderowania pozwalają kontrolować sposób rysowania linii. Tryb krokowy zamraża każdą EMA na ostatnim w pełni zamkniętym słupku źródłowym, więc wartość nigdy się nie zmienia, dopóki nie zamknie się słupek z wyższego interwału — zero przemalowań, w pełni wiarygodne dla decyzji handlu na żywo. Tryb płynny interpoluje ciągle między słupkami źródłowymi dla czystszego wizualnie efektu, lepiej nadającego się do analizy i przeglądu.
Co czyni go wyjątkowym Większość wskaźników multi-EMA oblicza wszystko na bieżącym interwale wykresu. Tutaj każda EMA jest naprawdę pobierana z własnego, niezależnego interwału. Nie przybliżasz — odczytujesz prawdziwą EMA, którą faktycznie widzą traderzy na tym interwale.
Funkcje
- Do 5 w pełni niezależnych EMA, każda z własnym interwałem i okresem
- Pozostań na dowolnym interwale wykresu, odczytując EMA z dowolnego innego interwału
- Tryb krokowy: wartości zablokowane na zamkniętych słupkach źródłowych, bez przemalowań
- Tryb płynny: interpolacja liniowa dla płynnych przejść wizualnych
- Przełącznik pokaz/ukryj dla każdej EMA, aby utrzymać wykres w czystości
Podsumowanie
Opinie klientów
5 | 50 % | |
4 | 50 % | |
3 | 0 % | |
2 | 0 % | |
1 | 0 % |


