
Penerangan
Penunjuk Jurang Nilai Adil
Gambaran Keseluruhan
Penunjuk Jurang Nilai Adil adalah alat ketepatan untuk pedagang tindakan harga yang ingin mengenal pasti, mengesan dan mengesahkan ketidakseimbangan pasaran jangka pendek. Ia secara automatik mengesan Jurang Nilai Adil (FVG) yang menaik dan menurun, menyerlahkan zon aktif (tidak diatasi) pada carta anda, dan merekodkan apabila harga kemudian mengisi (mengatasi) zon-zon tersebut. Ringan dan tidak melukis semula (beroperasi pada bar tertutup), penunjuk ini direka untuk analisis yang boleh dipercayai dalam perdagangan langsung dan ujian semula.
Ciri Utama
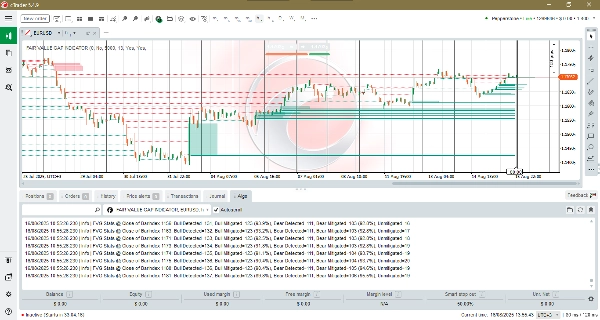
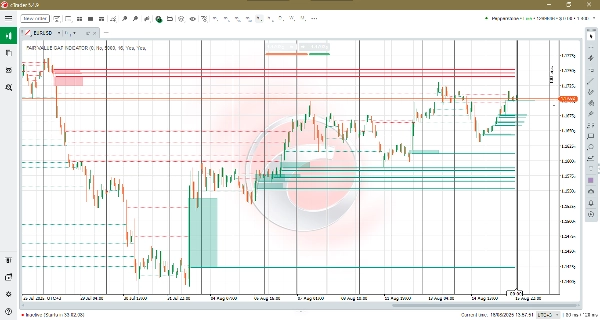
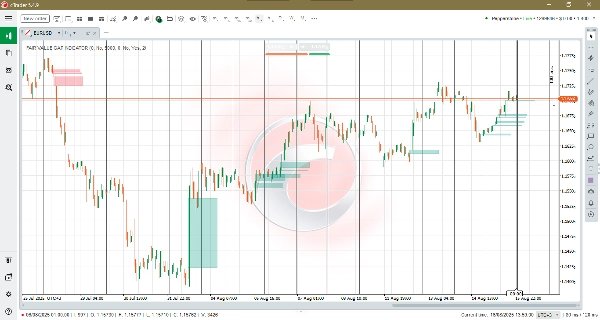
- Pengesanan FVG Automatik: Logik 3-bar yang kukuh mengenal pasti kedua-dua zon ketidakseimbangan menaik dan menurun serta melukis zon segi empat tepat yang bersih pada carta.
- Penjejakan Pengurangan: Apabila harga ditutup melalui zon, penunjuk mengeluarkan kotak dan boleh melukis garis pengurangan bertitik yang kekal untuk rujukan sejarah.
- Tindihan Tahap Tidak Diatasi: Menunjukkan N tahap tidak terisi terkini sebagai garis mendatar tebal yang dilukis dari bar pengesanan ke bar yang sedang terbentuk. Ini memudahkan imbasan visual Jurang Nilai Adil aktif (tidak diatasi) dan mengenal pasti tahap harga mereka dengan cepat.
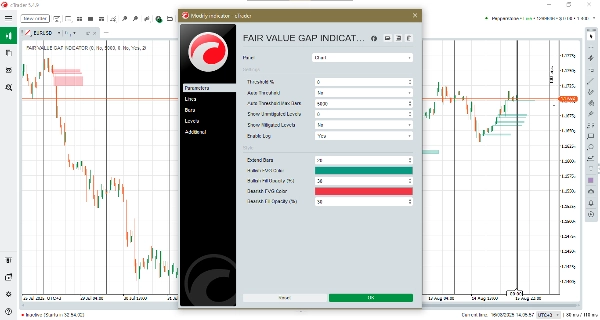
- Penetapan Ambang Manual & Auto: Pilih ambang relatif tetap atau aktifkan Ambang Auto untuk membolehkan penunjuk menyesuaikan diri dengan aktiviti pasaran terkini.
- Ambang Maksimum Bar Auto: Mengawal saiz tetingkap gelongsor yang digunakan untuk mengira ambang automatik. Nilai yang lebih besar melicinkan ambang (stabil sepanjang sejarah yang lebih panjang); nilai yang lebih kecil menjadikannya lebih responsif terhadap volatiliti terkini.
- Visual & Unjuran Tersuai: Tetapkan panjang lanjutan (sejauh mana kotak dilanjutkan), warna dan kelegapan isian untuk zon menaik dan menurun agar sesuai dengan gaya carta anda.
- Log Terminal: Baris log padat melaporkan jumlah FVG yang dikesan, pengurangan dan kiraan tidak diatasi semasa—ideal untuk pengesahan dan penalaan strategi.
- Logik Bar Tertutup: Direka untuk berjalan sekali setiap bar tertutup bagi meminimumkan lukisan semula.
Manfaat
- Rujukan perdagangan yang jelas: Cari dengan cepat zon ketidakseimbangan yang mungkin bertindak sebagai sasaran pulangan, kawasan reaksi, atau rujukan pengurusan perdagangan.
- Pengesahan & statistik: Gunakan log terminal dan peratusan pengurangan untuk mengesahkan isyarat dan melaras kepekaan untuk strategi anda.
- Kepekaan yang boleh disesuaikan: Ambang Auto + Bar Maksimum membolehkan penunjuk berfungsi dengan boleh dipercayai merentasi pasaran yang tenang dan tidak stabil tanpa penalaan manual berterusan.
- Visual yang padat & tidak mengganggu: Jejak visual minimum memastikan carta anda boleh dibaca sambil mengekalkan konteks penting.
Sesuai Untuk
Pedagang harian, pedagang ayunan dan scalper yang bergantung pada tindakan harga dan konsep ketidakseimbangan, serta penganalisis yang mengesahkan reaksi aliran pesanan dan prestasi strategi.
Kesimpulan
Penunjuk Jurang Nilai Adil menggabungkan pengesanan ketidakseimbangan yang tepat dengan analitik pengurangan dan penetapan ambang adaptif, memberikan anda pandangan yang fokus dan rendah bunyi mengenai ketidakseimbangan pasaran. Gunakannya untuk mengenal pasti potensi pulangan harga, mengurus perdagangan dengan lebih bijak, dan mengukur kekerapan zon diisi dalam pasaran anda.
Ringkasan
Key features include automated FVG detection, mitigation tracking, and an overlay showing recent unmitigated levels as bold horizontal lines for easy visual scanning. Users can select manual or automatic thresholding to adapt sensitivity to market conditions, with adjustable parameters controlling the responsiveness of the auto threshold. Customizable visual settings allow traders to tailor the appearance of bullish and bearish zones.
The indicator operates on closed bars to minimize repainting, ensuring reliable signals for live trading and backtesting. Terminal logging provides concise statistics on detected gaps and mitigations, aiding validation and strategy tuning.
Suitable for day traders, swing traders, scalpers, and analysts, the Fair Value Gap Indicator supports markets including Forex, indices, commodities, cryptocurrencies, and stocks. It offers a focused, low-noise view of market imbalances to assist in identifying potential price return targets and managing trades.
Ulasan pelanggan
5 | 100 % | |
4 | 0 % | |
3 | 0 % | |
2 | 0 % | |
1 | 0 % |


