
Penerangan
Apakah Penunjuk Garis Tren?
Penunjuk garis tren adalah alat analisis teknikal yang digunakan oleh pedagang dan penganalisis untuk mengenal pasti arah dan kekuatan tren dalam pasaran kewangan. Ia berdasarkan kepada melukis garis lurus yang menghubungkan dua atau lebih titik harga pada carta. Tujuan utama garis tren adalah untuk mewakili secara visual arah umum pergerakan harga sepanjang tempoh tertentu.
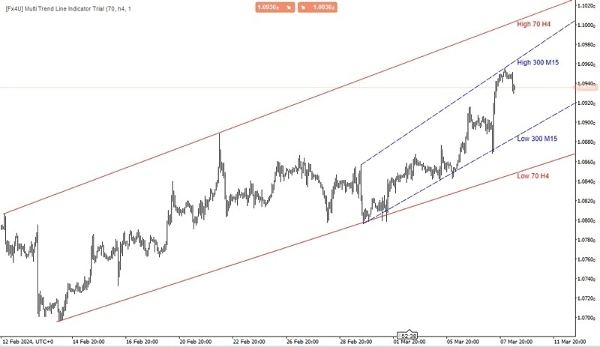
Penunjuk Garis Tren Pelbagai Jangka Masa
Fungsi utama penunjuk garis tren pelbagai jangka masa adalah untuk memberikan pedagang perspektif yang lebih luas mengenai tren pasaran dengan menggabungkan maklumat dari pelbagai jangka masa. Dengan menganalisis tren merentasi pelbagai jangka masa, pedagang dapat membuat keputusan yang lebih bijak mengenai titik masuk dan keluar yang berpotensi, serta arah keseluruhan pasaran.
Jenis penunjuk ini biasanya membolehkan pedagang menyesuaikan jangka masa yang ingin dianalisis dan melukis garis tren mengikutnya. Ia boleh menjadi alat yang bernilai untuk mengenal pasti tahap sokongan dan rintangan utama, pembalikan tren, dan kesinambungan tren merentasi jangka masa yang berbeza, dengan itu membantu pedagang membuat keputusan perdagangan yang lebih tepat.
Terdapat beberapa jenis garis tren, termasuk:
- Garis Tren Menaik: Ini dilukis dengan menghubungkan dua atau lebih titik rendah berturut-turut pada carta harga. Ia menunjukkan tren menaik, menandakan bahawa harga secara amnya meningkat dari masa ke masa.
- Garis Tren Menurun: Sebaliknya, garis tren menurun dilukis dengan menghubungkan dua atau lebih titik tinggi berturut-turut pada carta harga. Ia menunjukkan tren menurun, menandakan bahawa harga secara amnya menurun dari masa ke masa.
- Garis Tren Mendatar: Juga dikenali sebagai garis sokongan atau rintangan, ia dilukis secara mendatar untuk menunjukkan kawasan di mana pergerakan harga cenderung berhenti atau berbalik.
Pedagang sering menggunakan garis tren bersama dengan penunjuk teknikal dan kaedah analisis lain untuk membuat keputusan perdagangan yang bijak. Apabila garis tren pecah atau dilanggar, ia mungkin menunjukkan perubahan potensi dalam arah tren, memberikan isyarat perdagangan kepada pelabur.
Produk saya yang lain:
https://ctrader.com/products/346
https://ctrader.com/products/336
https://ctrader.com/products/343
https://ctrader.com/products/347
https://ctrader.com/products/148
Ringkasan
Ulasan pelanggan
5 | 67 % | |
4 | 0 % | |
3 | 33 % | |
2 | 0 % | |
1 | 0 % |
![Logo "[Fx4U] GBPUSD - Price Action"](https://cdn.ctrader.com/image/webp/d80b34fc-da3c-4f01-a321-456450665649_26190)

![Logo "[Fx4U] CADJPY - Price Action"](https://cdn.ctrader.com/image/webp/1ba81247-b6b7-4f3c-a297-fa3eb1d57fe1_26195)

![Logo "[Fx4U] AUDCHF - Price Action"](https://cdn.ctrader.com/image/webp/0a22e9aa-c83b-42cd-b0b8-c1a2da593207_26148)

![Logo "[Fx4U] EURAUD - Price Action"](https://cdn.ctrader.com/image/webp/baf8dde4-1ef3-4beb-8ae2-0fed8320f65d_26177)


