

Penerangan
VOLUME PROFILE FIXED RANGE — PRO
Kebanyakan petunjuk memberitahu anda ke mana harga pergi. Volume Profile memberitahu anda di mana pasaran benar-benar berdagang — tahap di mana pembeli dan penjual melakukan volume sebenar. Itulah tahap yang terus bertindak sebagai sokongan, rintangan dan magnet harga lama selepas pergerakan berakhir.
Penunjuk ini membawa Volume Profile profesional yang lengkap ke cTrader: pilih mana-mana julat pada carta anda, atau biarkan ia membina satu profil setiap hari dagangan secara automatik, dan segera lihat struktur volume, Titik Kawalan dan Kawasan Nilai.
🆕 BARU DALAM VERSI 3
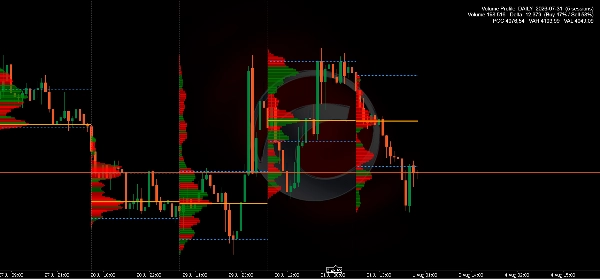
• Profil harian — setiap hari dagangan mendapat profil, POC dan Kawasan Nilai sendiri, dilukis di dalam hari itu dan dibina secara automatik semasa anda menatal.
• Sesi pendek digabungkan — pembukaan Ahad yang nipis dan separuh hari cuti digabungkan ke hari dagangan berikutnya dan bukannya meninggalkan profil kecil yang terhad.
• Histogram di dalam julat — kedudukan ketiga yang mengikat profil ke julatnya sendiri dan bukannya tepi carta, supaya ia kekal di tempatnya semasa anda menatal.
• Tahap yang kekal dalam julat mereka — POC, VAH dan VAL hanya boleh merangkumi sesi mereka sendiri dan bukannya keseluruhan carta, yang menjadikan pelbagai profil mudah dibaca.
• Amaran tahap — pemberitahuan pilihan apabila harga menyentuh POC, VAH atau VAL, dengan masa rehat supaya tahap yang diuji tidak mengganggu anda secara berlebihan.
• Profil langsung — volume lilin semasa termasuk semasa berdagang, bukan hanya selepas bar ditutup.
📊 APA YANG DITUNJUKKAN
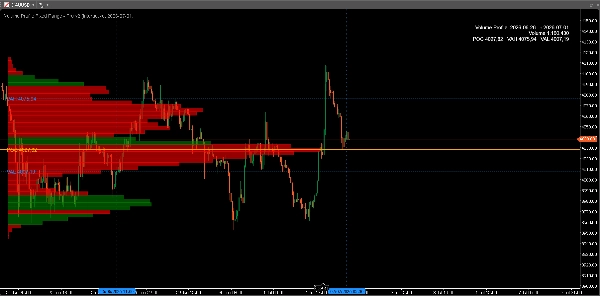
• POC (Point of Control) — tahap harga dengan volume dagangan tertinggi dalam julat.
• Kawasan Nilai (VAH / VAL) — zon yang mengandungi 70% daripada semua volume (boleh laras dari 50% hingga 95%), dikira dengan kaedah pengembangan Market Profile standard supaya tahap anda sepadan dengan apa yang dilihat oleh profesional di platform lain.
• Histogram volume — 10 hingga 400 baris harga, setiap baris dibahagikan kepada volume pembelian dan penjualan supaya penyerapan dan ketidakseimbangan dapat dilihat dengan sekilas pandang.
• POC yang berkembang — bagaimana harga paling adil berkembang merentasi julat (pilihan).
• Ketepatan tahap minit — profil dibina dari data M1 walaupun pada carta H1 atau Harian, jauh lebih tepat daripada anggaran berasaskan bar.
🎯 CARA PEDAGANG MENGGUNAKANNYA
• Reaksi dagangan di POC — ia sering bertindak sebagai sokongan/rintangan kuat dan magnet pemulihan purata.
• Gunakan tepi Kawasan Nilai untuk menentukan sempadan julat dan mengenal pasti penembusan sebenar.
• Bandingkan profil yang sedang berkembang hari ini dengan semalam untuk melihat sama ada nilai bergerak naik, turun atau kekal.
• Kenal pasti zon volume rendah di mana harga cenderung bergerak pantas — sasaran semula jadi dan kawasan hentian.
• Sahkan tahap utama anda dengan penyertaan pasaran sebenar dan bukan hanya tindakan harga.
⚙️ BOLEH DISESUAIKAN SEPENUHNYA
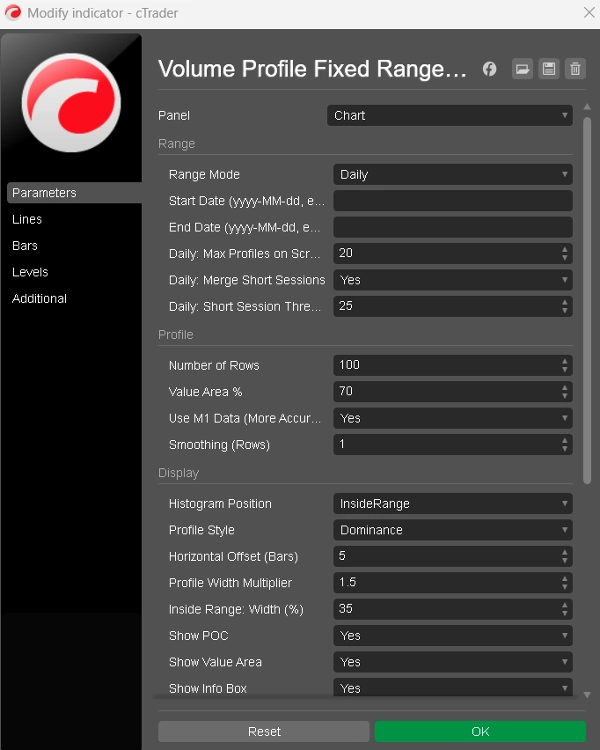
• Tiga mod julat: seret dua garis pada carta, taip tarikh tetap, atau Harian.
• Tiga kedudukan histogram: tepi kanan, tepi kiri, atau di dalam julat.
• Baris, peratusan Kawasan Nilai, pelicinan, lebar, offset dan sempadan baris.
• Dua gaya histogram: pembahagian beli/jual atau warna dominasi tunggal.
• Setiap warna boleh disesuaikan; POC, Kawasan Nilai, pemisah hari, panel info dan POC yang berkembang boleh dihidupkan atau dimatikan, dan panel info boleh diletakkan di mana-mana sudut.
🔧 DIBINA UNTUK PENGGUNAAN HARIAN
• Berfungsi pada mana-mana simbol dan mana-mana jangka masa.
• Tetapan lalai yang munasabah — profil boleh digunakan muncul beberapa saat selepas anda memasangnya, tiada persediaan diperlukan.
• Julat yang anda pilih kekal walaupun bertukar jangka masa dan memulakan semula.
• Sejarah lama dimuatkan secara automatik apabila julat anda memerlukannya, dan carta memberitahu anda apabila data yang tersedia tidak meliputi permintaan.
• Lancar dan cekap: profil mengikuti penatalan dan zum tanpa berkelip, dan mengira semula hanya apabila perlu.
• Pembelian sekali sahaja. Tiada langganan. Kemas kini percuma.
Jika analisis volume adalah sebahagian daripada proses anda — atau anda mahu ia menjadi — ini memberi anda set alat Volume Profile lengkap, dibina secara asli untuk cTrader.
Ringkasan
Users can interactively select the range by dragging lines on the chart or specify fixed start and end dates. The volume histogram displays buy and sell volume splits per price level, enabling identification of buying/selling pressure and volume imbalances. Additional features include a developing POC line showing how the fair price evolved within the range, adjustable smoothing for profile shape refinement, and a theme-aware design for readability on different chart backgrounds.
The indicator supports full customization of rows, histogram style, colors, and display elements. It automatically loads historical data as needed and recalculates only when the selected range changes, optimizing performance. It is suitable for any symbol and timeframe, providing traders with volume-based support and resistance levels, breakout zones, and areas of low volume that may indicate rapid price movement.
Ulasan pelanggan
5 | 67 % | |
4 | 0 % | |
3 | 33 % | |
2 | 0 % | |
1 | 0 % |







![Logo "[Hamster-Coder] Moving Average MTF"](https://cdn.ctrader.com/image/webp/b11b98b1-194d-4b8e-b00e-d611826ad159_31226)










