
Fair Value Gap Pro+
Indicatore
Versione 1.0, Nov 2025
Windows, Mac
3.0
Recensioni: 2
Descrizione
Fair Value Gap Pro – Rilevamento FVG di livello istituzionale
📝 Descrizione del prodotto
Sblocca la precisione istituzionale con Fair Value Gap Pro
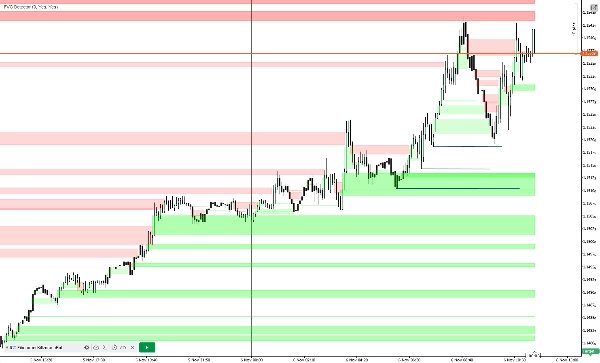
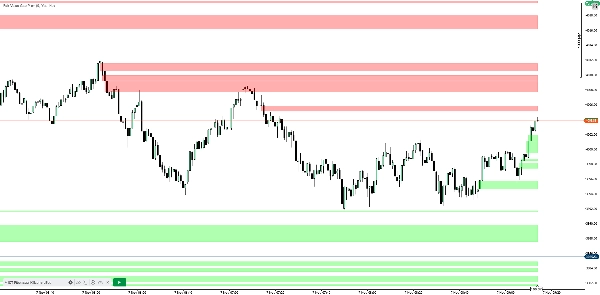
Fair Value Gap Pro è un potente indicatore sovrapposto progettato per i trader che vogliono identificare e sfruttare le inefficienze di prezzo istituzionali con precisione chirurgica. Creato per scalper, trader swing e strateghi algoritmici, questo strumento rileva automaticamente i Fair Value Gap (FVG) rialzisti e ribassisti utilizzando una logica a 3 candele—niente fronzoli, solo zone azionabili.
🔍 Caratteristiche principali:
- Rilevamento automatico di FVG rialzisti e ribassisti usando la logica della candela 1 e candela 3
- Filtro dimensione gap personalizzabile (in pips) per eliminare il rumore
- Logica estendi-finché-non-viene-riempito per il tracciamento persistente della zona
- Svanisci o rimuovi i gap riempiti per una visualizzazione pulita del grafico
- Visualizzazione sovrapposta con rettangoli semi-trasparenti
- Personalizzazione dei colori per le zone rialziste e ribassiste
🧠 Vantaggio strategico:
- Individua zone di inversione ad alta probabilità prima della massa
- Allineati con modelli istituzionali come ICT e Market Maker Theory
- Usa in congiunzione con blocchi d'ordine, vuoti di liquidità e zone di squilibrio
📊 Casi d'uso
- Scalping: Identifica micro-squilibri per ingressi da cecchino
- Swing Trading: Traccia gap non riempiti tra le sessioni
- Sviluppo algoritmico: Integra con bot per logica di zona automatizzata
- Backtesting: Valida il comportamento degli FVG su dati storici
⚙️ Parametri
- Colore Gap Rialzista: Definisce il colore usato per evidenziare i Fair Value Gap rialzisti sul grafico.
- Colore Gap Ribassista: Definisce il colore usato per evidenziare i Fair Value Gap ribassisti.
- Gap minimo (pips): Filtra i gap più piccoli della soglia pip specificata per ridurre il rumore.
- Estendi finché non viene riempito: Mantiene la zona gap estesa in avanti nel tempo finché il prezzo non la riempie.
- Mostra gap riempiti: Permette di svanire o rimuovere completamente le zone una volta che sono state riempite.
🎯 Pubblico target
- Trader che utilizzano ICT, SMC o modelli istituzionali
- Sviluppatori che costruiscono bot basati sulla congiunzione
- Analisti in cerca di chiarezza visiva sulle inefficienze di prezzo
📦 Idee bonus per la descrizione dello store
- Aggiungi screenshot che mostrano gap rialzisti e ribassisti in azione
- Includi una breve demo video con walkthrough del grafico in tempo reale
- Offri una prova gratuita o una versione limitata per aumentare le conversioni
Riepilogo
Riepilogo AI
Fair Value Gap Pro+ is an overlay indicator designed to identify and visualize institutional price inefficiencies known as Fair Value Gaps (FVGs) on trading charts. It automatically detects bullish and bearish FVGs using a three-candle logic, highlighting these zones with customizable semi-transparent rectangles. The indicator includes features such as adjustable minimum gap size filters to reduce noise, extend-until-filled logic to track persistent zones, and options to fade or remove filled gaps for clearer chart analysis. Users can customize colors for bullish and bearish gaps to suit their preferences.
This tool supports various trading styles including scalping, swing trading, algorithmic strategy development, and backtesting. It aligns with institutional trading models like ICT and Market Maker Theory and can be used in conjunction with order blocks, liquidity voids, and imbalance zones to identify high-probability reversal areas. Fair Value Gap Pro+ is applicable across multiple markets including Forex, indices, commodities, cryptocurrencies, and stocks. It is suitable for traders, analysts, and developers seeking precise detection of market imbalances and enhanced visual clarity on price inefficiencies.
This tool supports various trading styles including scalping, swing trading, algorithmic strategy development, and backtesting. It aligns with institutional trading models like ICT and Market Maker Theory and can be used in conjunction with order blocks, liquidity voids, and imbalance zones to identify high-probability reversal areas. Fair Value Gap Pro+ is applicable across multiple markets including Forex, indices, commodities, cryptocurrencies, and stocks. It is suitable for traders, analysts, and developers seeking precise detection of market imbalances and enhanced visual clarity on price inefficiencies.
Profilo indicatore
Recensioni dei clienti
3.0
Recensioni: 2
5 | 50 % | |
4 | 0 % | |
3 | 0 % | |
2 | 0 % | |
1 | 50 % |
Recensioni dei clienti
November 9, 2025
Absolutely no multi-timeframe support despite this line in the description: ✅ Multi-Timeframe Support Display higher timeframe FVGs (e.g., H1, H4, D1) directly on lower charts like M5 or M15 for confluence.
November 9, 2025
Fair Value Gap Pro+ is a top-tier ICT tool - precise FVG detection, clean visuals, and real-time updates. Perfect for mapping imbalance zones and timing entries. A dream for Smart Money traders; adding alerts would make it flawless.
Discussioni
Domande frequenti
Signal
Indices
Commodities
GBPUSD
RSI
Bollinger
Fibonacci
Scalping
AI
XAUUSD
NAS100
MACD
BTCUSD
Forex
Breakout
EURUSD
Martingale
Prop
ZigZag
Supertrend
Fair Value Gap
SMC
Crypto
Grid
Stocks
ATR
USDJPY
VWAP
I prodotti disponibili tramite cTrader Store, inclusi bot di trading, indicatori e plugin, sono forniti da sviluppatori terzi e resi disponibili esclusivamente a scopo informativo e di accesso tecnico. cTrader Store non è un broker e non fornisce consulenze in materia di investimento, raccomandazioni individualizzate o garanzie di risultati futuri.


Prezzo
Da 22/11/2024
135
Vendite
2.6K
Installazioni gratuite