
Penerangan
Support & Resistance Pro mengenal pasti zon sokongan dan rintangan dan — tidak seperti kebanyakan alat S/R — mengukur sama ada zon-zon tersebut benar-benar berfungsi, menggunakan enjin statistik bebas yang dibina berdasarkan data sejarah sebenar dan bukannya andaian. Setiap zon menunjukkan statistik kadar pegangan dengan selang keyakinan, dikira daripada populasi zon sejarah lengkap, termasuk zon yang kemudian pecah dan hilang dari carta. Kebanyakan penunjuk dalam kategori ini hanya mengira tahap yang masih kelihatan hari ini, yang secara senyap-senyap membesarkan setiap tuntutan kekuatan yang dibuat. Yang ini tidak.
Ciri Utama
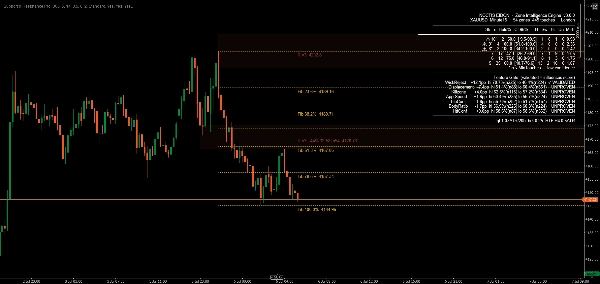
- Zon yang Disahkan Secara Statistik Setiap zon membawa kadar pegangan sebenar yang diukur secara sejarah dengan selang keyakinan 95% — bukan skor kekuatan yang diandaikan. Satu isyarat, penolakan sumbu pada titik sentuhan, telah disahkan secara rasmi: disahkan pada EURUSD dan Bitcoin, merentasi pelbagai jangka masa, termasuk ujian luar sampel sebenar di mana kesan tersebut mengekalkan kekuatan pada data yang tidak pernah dilihat.
- Pembalikan Peranan Automatik Sokongan yang pecah secara automatik menjadi rintangan, dan sebaliknya, dengan penanda visual yang jelas — penunjuk mengesan sisi harga di mana zon berada dan mewarnakannya dengan sewajarnya, bukannya menetapkan warna berdasarkan bagaimana zon itu asalnya terbentuk.
- Konfluens Jangka Masa Lebih Tinggi Zon pada carta anda diperiksa terhadap jangka masa lebih tinggi pilihan anda, dengan struktur HTF yang sepadan dilukis terus pada carta sebagai lapisan visual berasingan.
- Integrasi Penarikan Fibonacci Tahap penarikan Fibonacci automatik dari ayunan terkini, setiap satu dilabel dengan nisbah dan harga tepat dalam ketepatan asli broker anda, disusun semula secara automatik berbanding zon berdekatan supaya label tidak pernah bertindih.
- Amaran Jenuhnya Zon yang diuji terlalu banyak kali ditandakan dan bukannya diandaikan lebih kuat — data kami menunjukkan zon yang diuji dengan berat cenderung berprestasi lebih teruk, bukan lebih baik, mungkin kerana kecairan rehat mereka telah digunakan sepenuhnya.
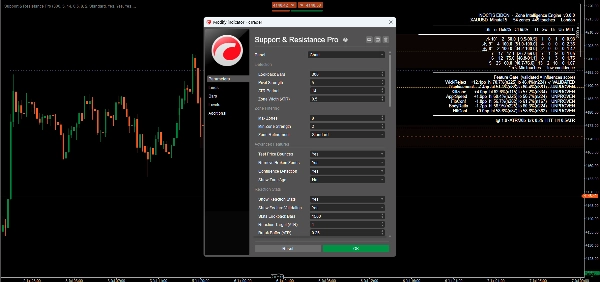
- Pintu Pengesahan Terbuka Enam isyarat calon tambahan — nisbah badan, kelajuan pendekatan, masa sesi/zona pembunuh, dan ujian perpindahan — dipaparkan secara langsung pada panel statistik terbina dengan bacaan kadar pegangan mereka sendiri. Mereka tidak mempengaruhi sebarang skor atau kedudukan sehingga setiap satu secara bebas melepasi bar bukti yang sama seperti penolakan sumbu. Anda dapat melihat dengan tepat apa yang terbukti dan apa yang tidak.
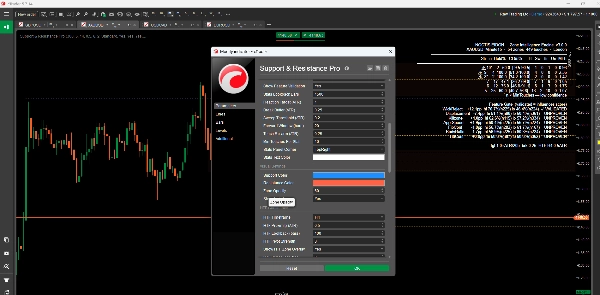
- Tetapan Boleh Disesuaikan Kawalan parameter yang luas merentasi kepekaan pengesanan, penapisan zon, gaya visual, dan tingkah laku amaran.
- Amaran Masa Nyata Amaran pop-up, emel, dan bunyi yang boleh dikonfigurasikan untuk sentuhan zon, pecahan, dan acara konfluens, boleh dihidupkan atau dimatikan secara berasingan untuk setiap saluran.
Manfaat
- Bukti berbanding andaian: setiap statistik pada carta boleh diperiksa secara bebas — penunjuk termasuk alat pengesahan dalam sampel/luar sampel sendiri
- Tiada bias kelangsungan: tuntutan kekuatan dibina berdasarkan populasi zon sejarah lengkap, bukan hanya tahap yang kebetulan bertahan
- Pendedahan jujur: isyarat yang terbukti dan yang tidak terbukti dilabelkan sedemikian, pada carta, pada setiap masa
Sesuai Untuk
Pedagang yang ingin melihat bukti statistik di sebalik sesuatu tahap, bukan sekadar garis — pedagang harian, pedagang ayunan, dan pedagang sistematik merentasi forex, kripto, dan instrumen lain yang mencari pendekatan yang diukur secara ketat terhadap sokongan dan rintangan.
Kesimpulan
Support & Resistance Pro dibina berdasarkan satu prinsip: tuntutan kekuatan tidak benar sehingga ia diukur. Satu isyarat telah melepasi halangan itu dengan pengesahan merentas instrumen, merentas jangka masa, dan luar sampel. Yang lain dipaparkan dengan jujur sebagai masih dalam ujian — kerana nombor yang anda tidak boleh sahkan tidak berbaloi untuk dipaparkan sama sekali.
Ringkasan
- Dynamic support and resistance levels that adjust in real-time based on recent price action.
- Multi-timeframe analysis to view levels across different timeframes for a comprehensive market overview.
- Calculation and display of pivot points to mark potential intraday reversal zones and target prices.
- Highlighting of psychological price levels (round numbers) to gauge market sentiment.
- Integration of Fibonacci retracement levels to assist in identifying support and resistance during price corrections.
- Customizable settings for lookback periods, visualization styles, and color schemes to suit individual trading preferences.
- Clear graphical representation for easy identification of market conditions.
- Configurable real-time alerts when prices approach critical levels.
This indicator supports various trading styles including scalping, day trading, and swing trading, and is suitable for traders in forex, commodities, stocks, and indices markets. It is intended for both beginner and experienced traders seeking structured market analysis and enhanced decision-making through reliable support and resistance data.
Ulasan pelanggan
5 | 100 % | |
4 | 0 % | |
3 | 0 % | |
2 | 0 % | |
1 | 0 % |


