
Penerangan
Jika anda mencari penunjuk saluran Fibonacci dinamik untuk cTrader, tidak perlu mencari lagi. Penunjuk ini secara automatik melukis jalur Fibonacci selari dengan purata bergerak pilihan anda. Ia mesra pengguna dan, seperti penunjuk saya yang lain, menyediakan amaran melalui Pop-up, Bunyi, E-mel, dan mesej Telegram. Selain itu, anda mempunyai fleksibiliti untuk menyesuaikan Jalur, tahap Fibonacci, dan Amaran.
Berikut adalah senarai ciri-cirinya:
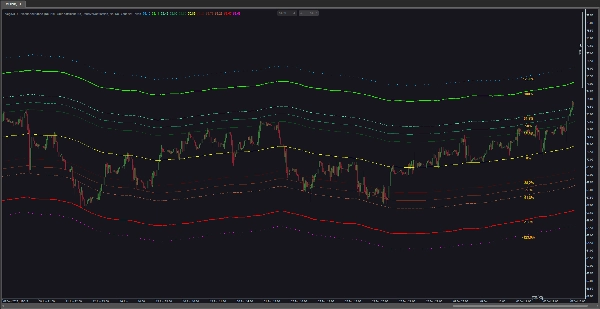
- Pengiraan Jalur Fibonacci: Penunjuk mengira dan melukis jalur Fibonacci berdasarkan purata bergerak yang anda pilih. Jalur ini berasal dari tahap Fibonacci (contohnya, 0.0%, 38.2%, 61.8%, atau lain-lain) dan meluas di atas dan di bawah purata bergerak dengan faktor yang ditentukan.
- Konfigurasi Purata Bergerak: Sesuaikan jenis purata bergerak (contohnya, Mudah, Eksponen, dll.) dan bilangan tempoh yang digunakan dalam pengiraan. Purata bergerak berfungsi sebagai asas untuk jalur Fibonacci.
- Fungsi Amaran: Penunjuk menawarkan pelbagai pilihan amaran untuk memberitahu pedagang tentang peristiwa tertentu. Ini termasuk amaran sentuhan tahap harga dan amaran kedekatan.
- Amaran Sentuhan Tahap Harga: Konfigurasikan penunjuk untuk mencetuskan amaran apabila harga menyentuh tahap Fibonacci tertentu. Amaran boleh berdasarkan harga penutupan atau segera apabila harga menyentuh tahap tersebut.
- Amaran Kedekatan: Tetapkan amaran kedekatan untuk menerima pemberitahuan apabila harga menghampiri atau menjauh dari tahap Fibonacci yang ditentukan dalam jarak yang ditetapkan. Amaran boleh dicetuskan apabila harga menghampiri atau menjauh dari tahap tersebut.
- Pilihan Output Amaran: Pilih dari amaran bunyi, pop-up, mesej Telegram, dan pemberitahuan e-mel untuk amaran. Amaran bunyi boleh disesuaikan dengan memilih fail bunyi yang berbeza.
- Pilihan Visualisasi: Sesuaikan visualisasi tahap Fibonacci dengan pilihan seperti memaparkan nilai peratusan, menetapkan warna untuk label peratusan, mengawal lokasi label pada carta, mengaktifkan/mematikan jalur tertentu, dan memilih warna, ketebalan, dan penampilan jalur.
- Tahap Fibonacci Boleh Dikonfigurasi: Sesuaikan penunjuk mengikut strategi dagangan anda dengan melaraskan tahap Fibonacci tertentu yang digunakan dalam pengiraan. Tahap Fibonacci positif dan negatif boleh disesuaikan secara individu.
- Panduan Pengguna Terbina Dalam: Anda boleh mengakses panduan pengguna untuk penunjuk ini terus dari carta.
Kesimpulannya, penunjuk VegaXLR - Jalur Fibonacci menggabungkan analisis Fibonacci dan purata bergerak untuk membantu mengenal pasti potensi tahap sokongan dan rintangan. Dengan fungsi amaran yang boleh dikonfigurasi dan pilihan visualisasi, ia adalah alat yang sangat berguna untuk pedagang yang bergantung pada retracement atau pengembangan Fibonacci.
Ringkasan
It features multiple alert options including price level touch alerts—triggered on price contact or close at specified Fibonacci levels—and proximity alerts that notify when price approaches or moves away from these levels within a defined range. Alerts can be delivered via pop-up, sound (with customizable sounds), email, and Telegram messages.
Visualization settings enable customization of band colors, thickness, label display and position, and selective enabling or disabling of bands. A built-in user guide is accessible directly from the chart for ease of use.
Overall, VegaXLR - Fibonacci Bands combines Fibonacci retracement and expansion analysis with moving averages to assist traders in identifying potential support and resistance zones, enhanced by configurable alerts and visualization options.
Ulasan pelanggan
5 | 100 % | |
4 | 0 % | |
3 | 0 % | |
2 | 0 % | |
1 | 0 % |


![Logo "Smart Money Concepts (SMC) [Iridio Capital]"](https://cdn.ctrader.com/image/webp/28b69fd1-ef54-4bed-9487-07e78e883be4_40934)


