
Penerangan
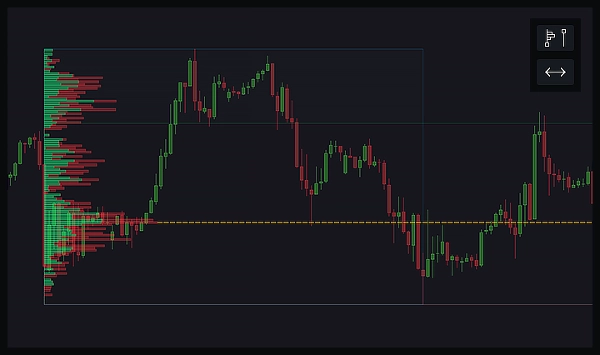
Profil Isipadu Julat Tetap adalah alat yang menunjukkan berapa banyak aktiviti dagangan yang berlaku pada tahap harga yang berbeza dalam julat tertentu pada carta. Anda melukis segi empat tepat di atas kawasan yang anda minati, dan profil tersebut memaparkan bar mendatar yang menunjukkan isipadu dagangan pada setiap tahap harga dalam julat itu. Ini membantu anda melihat di mana pembelian dan penjualan paling banyak berlaku, menonjolkan tahap harga utama yang mungkin penting untuk membuat keputusan dagangan.
Komponen utama Profil Isipadu Julat Tetap termasuk:
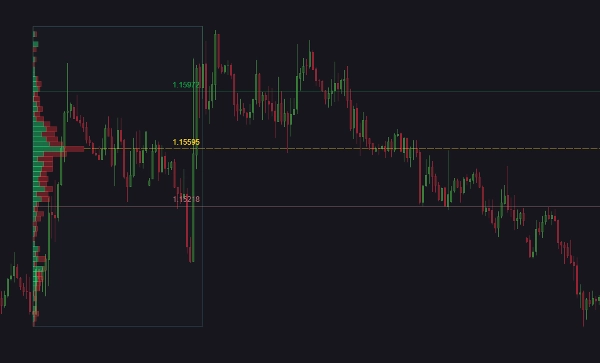
- Titik Kawalan (POC): Tahap harga dengan isipadu dagangan tertinggi dalam julat yang dipilih. Ini sering dilihat sebagai tahap sokongan atau rintangan yang penting kerana ia mencerminkan harga di mana banyak aktiviti dagangan berlaku.
- Nilai Kawasan Tinggi (VAH): Sempadan atas julat harga di mana 70% daripada jumlah isipadu dagangan berlaku. Harga di atas tahap ini dianggap kurang didagangkan dan berpotensi dinilai terlalu tinggi.
- Nilai Kawasan Rendah (VAL): Sempadan bawah julat harga di mana 70% daripada jumlah isipadu dagangan berlaku. Harga di bawah tahap ini dianggap kurang didagangkan dan berpotensi dinilai terlalu rendah.
Garis-garis ini membantu pedagang mengenal pasti tahap harga penting yang boleh bertindak sebagai sokongan atau rintangan. Dengan memahami di mana sebahagian besar isipadu dagangan tertumpu, pedagang boleh membuat keputusan yang lebih bermaklumat tentang pergerakan harga yang berpotensi, titik masuk, dan keluar.
Sebagai contoh, jika harga semasa hampir dengan POC, ia mungkin menunjukkan tahap sokongan atau rintangan yang kuat. Jika harga berada dalam kawasan nilai, ia menunjukkan bahawa ia berada dalam julat nilai yang adil, manakala harga di luar kawasan nilai mungkin dilihat sebagai titik pecah atau runtuh yang berpotensi.
Apa yang Indikator Ini Lakukan:
Indikator ini meningkatkan carta dagangan anda dengan analisis profil isipadu yang kuat dan amaran yang boleh disesuaikan. Dengan dua butang intuitif, anda boleh dengan mudah melukis profil isipadu julat tetap dan mengembangkan atau mengecilkan tahap utama ke infiniti. Profil isipadu boleh divisualisasikan dalam dua mod berbeza, jumlah atau bar naik dan turun. Laraskan bilangan tahap, resolusi data (Tepat atau Pantas), dan saiz kawasan nilai mengikut keperluan anda.
Julat magnetik dikemas kini secara automatik berdasarkan lilin terakhir, memastikan analisis anda sentiasa terkini. Anda juga boleh menyesuaikan penampilan dan tingkah laku profil dan komponennya, termasuk garis POC, VAH, dan VAL. Amaran boleh ditetapkan untuk sentuhan harga, dengan pilihan untuk mencetuskan tindakan seperti memulakan atau menghentikan cBot, dan menutup posisi. Amaran boleh dihantar melalui bunyi, pop-up cTrader, mesej Telegram (dengan tangkapan skrin pilihan), dan emel.
Ciri-ciri:
- Profil Isipadu Julat Tetap: Lukis segi empat tepat untuk memvisualisasikan profil isipadu julat yang dipilih.
- Kembangkan/Kontrak Garis: Luaskan atau kecilkan garis POC, VAH, dan VAL ke infiniti.
- Mod Profil Isipadu: Pilih antara jumlah isipadu atau bar naik dan turun.
- Tahap dan Resolusi Boleh Disesuaikan: Pilih bilangan tahap dan resolusi (Tepat atau Pantas).
- Kawasan Nilai Boleh Laras: Tetapkan saiz kawasan nilai.
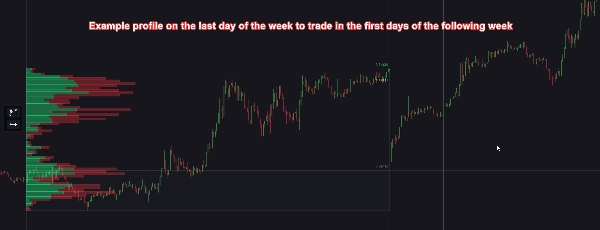
- Julat Magnetik: Saiz julat secara automatik diselaraskan dengan lilin terakhir, dikemas kini setiap 1–10 minit atau pada penutupan bar.
- Penampilan Boleh Disesuaikan: Tukar kedudukan, saiz, dan gaya butang, garis, dan bar isipadu.
- Amaran untuk Sentuhan Harga: Dapatkan pemberitahuan apabila harga menyentuh garis POC, VAH, atau VAL.
- Integrasi cBot: Mulakan atau hentikan cBot berdasarkan amaran.
- Pengurusan Posisi: Tutup posisi apabila amaran berlaku, dengan pilihan boleh disesuaikan untuk setiap garis (POC, VAH, dan VAL).
- Kaedah Amaran: Terima amaran melalui bunyi, pop-up cTrader, mesej Telegram (dengan tangkapan skrin pilihan), dan emel.
- Pengoptimuman Prestasi: Pilihan untuk memadam julat lalu yang tidak kelihatan pada carta secara automatik untuk meningkatkan prestasi.
- Kawalan Amaran Global: Mudah mengaktifkan atau menyahaktifkan semua amaran dari indikator ini.
- Panduan Pengguna: Anda boleh membuka panduan pengguna indikator ini dengan mudah melalui butang kecil pada carta.
Ringkasan
The indicator offers two visualization modes: total volume or separate up and down volume bars. It features customizable settings for the number of volume levels, data resolution (Precise or Fast), and value area size. Magnetic ranges automatically update based on the latest candle to keep analysis current. Users can expand or contract POC, VAH, and VAL lines infinitely.
Alerts can be configured for price touches on these key levels, with notifications via sound, platform pop-ups, Telegram (including optional screenshots), and email. Alerts can trigger actions such as starting/stopping cBots or closing positions. The indicator also supports customizable appearance, performance optimization by auto-deleting out-of-view ranges, and global alert control. A user guide is accessible directly from the chart interface.
Ulasan pelanggan
5 | 67 % | |
4 | 0 % | |
3 | 33 % | |
2 | 0 % | |
1 | 0 % |


