

present
Daftar dan dapatkan potongan bernilai $50 untuk pembelian pertama anda
Trading product for Fixed Range Volume profile Indikator Key Levels Imbalance, image 1
Fixed Range Volume profile
Indikator
1 pembelian
Versi 1.0, Jul 2026
Windows, Mac
Trading product for Fixed Range Volume profile Indikator Key Levels Imbalance, image 2
Trading product for Fixed Range Volume profile Indikator Key Levels Imbalance, image 3
Trading product for Fixed Range Volume profile Indikator Key Levels Imbalance, image 4
Sejak 14/01/2025
2
Jualan
143
Pemasangan percuma

Penerangan

PROFIL VOLUM JULAT TETAP (FRVP)

Penunjuk Profil Isipadu Pengesanan Automatik


--------------------------------------------------


Pengagihan isipadu. Kawasan nilai. Nod isipadu tinggi. Semua dari garisan tren anda.


--------------------------------------------------


APA YANG DILAKUKAN PENUNJUK INI


Profil Isipadu Julat Tetap (FRVP) memaparkan pengagihan isipadu ke atas julat yang ditetapkan pengguna β€” secara automatik mengesan garisan tren terkini yang anda lukis pada carta.


Tiada pemilihan julat manual diperlukan. Cuma lukis garisan tren dan profil akan muncul.


--------------------------------------------------


CIRI-CIRI UTAMA


- MENGESAN AUTOMATIK garisan tren terkini (tiada penamaan manual diperlukan)

- Titik Kawalan (POC) - tahap isipadu tertinggi

- Kawasan Nilai (VAH + VAL) - peratusan boleh dikonfigurasikan (default 70%)

- Nod Isipadu Tinggi (HVN) - isipadu melebihi ambang purata

- Paparan histogram (kiri atau kanan julat)

- Baris boleh dikonfigurasikan (10 hingga 200)

- Warna dan kelegapan boleh disesuaikan

- Lanjutkan garisan ke kanan

- Tunjuk/sembunyi label harga

- Tiada lukisan semula


--------------------------------------------------


BAGAIMANA IA BERFUNGSI


1. Lukis garisan tren pada carta

2. Penunjuk mengesannya secara automatik

3. Profil isipadu dikira dari julat

4. POC, VAH, VAL, dan HVN dipaparkan


Tiada penamaan diperlukan. Tiada pemilihan julat manual.


--------------------------------------------------


ELEMEN VISUAL


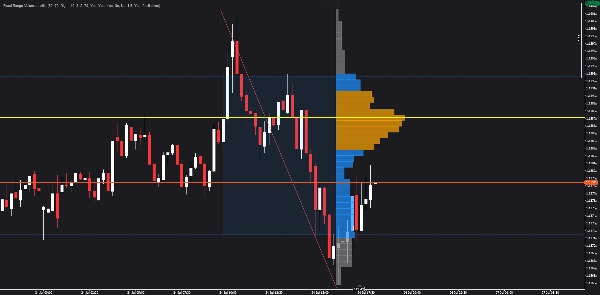
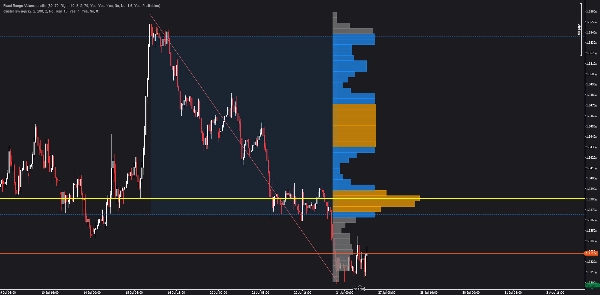
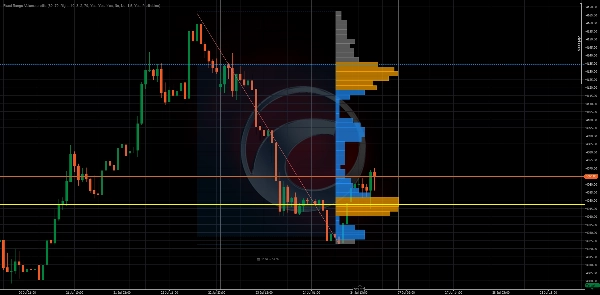
- Garisan mendatar kuning = Titik Kawalan (POC)

- Garisan putus-putus biru = Kawasan Nilai Tinggi (VAH) dan Kawasan Nilai Rendah (VAL)

- Bar oren = Nod Isipadu Tinggi (HVN)

- Bar kelabu = nod isipadu rendah

- Kawasan berbayang = Kawasan Nilai (70% isipadu)

- Histogram = Pengagihan isipadu mengikut tahap harga


--------------------------------------------------


TINJAUAN PARAMETER


PENETAPAN PROFIL:

- Bilangan Baris: Berapa banyak baris harga (10-200)

- Peratusan Kawasan Nilai: % isipadu dalam kawasan nilai (1-100)


PENETAPAN VISUAL:

- Sisi Profil: Kiri atau Kanan julat

- Lebar Histogram %: Lebar bar histogram

- Skala Lebar Bar: Faktor skala untuk lebar bar

- Lebar Bar Minimum %: Lebar bar minimum

- Kelegapan Bar: Ketelusan bar (10-100)


WARNA:

- Warna POC

- Warna Kawasan Nilai

- Warna Nod Isipadu Tinggi

- Warna Isipadu Rendah


NOD ISIPADU TINGGI:

- Ambang HVN: Pendaraban isipadu untuk layak sebagai HVN


PENETAPAN GARISAN TREN:

- Pengesanan Automatik Terkini: Cari garisan tren terkini secara automatik

- Nama Garisan Tren Manual: Tentukan nama (jika pengesanan automatik dimatikan)


--------------------------------------------------


KES PENGGUNAAN


- Kenal pasti di mana isipadu paling banyak berlaku

- Cari Titik Kawalan (POC) untuk kemasukan/keluaran

- Gunakan Kawasan Nilai (VAH/VAL) untuk sasaran keuntungan

- Kenal pasti Nod Isipadu Tinggi (HVN) untuk tahap utama

- Fahami pengagihan isipadu dengan pantas

- Gabungkan dengan penunjuk lain untuk kesesuaian


--------------------------------------------------


TINGKATKAN KEPADA ZON PANAS STRUKTURAL


Penunjuk ini menunjukkan pengagihan isipadu.


Zon Panas Struktural membawa lebih jauh β€” ia memetakan intensiti penyertaan, penerimaan vs penolakan, dan penglibatan pasaran merentasi pelbagai zon.


Cari Zon Panas Struktural di Kedai cTrader.


--------------------------------------------------


TINGKATKAN KEPADA INVICTUS EA


Invictus EA menggunakan teknologi struktural untuk melaksanakan dagangan automatik.


Cari Invictus di Kedai cTrader.


--------------------------------------------------


NOTA TEKNIKAL


- Penunjuk lapisan atas

- Berfungsi pada mana-mana jangka masa dan simbol

- Tiada lukisan semula (pengiraan sejarah)

- Dioptimumkan untuk prestasi


--------------------------------------------------


SOKONGAN


Kemas kini seumur hidup disertakan.


UNTUK MAKLUMAT LANJUT - Klik Profil Pembangun di bawah.

Ringkasan

Ringkasan AI
Fixed Range Volume Profile (FRVP) is a volume profile indicator designed for trading charts that automatically detects the latest trendline drawn by the user. It calculates and displays volume distribution within the fixed range defined by this trendline, eliminating the need for manual range selection. Key features include visualization of the Point of Control (POC) representing the highest volume price level, Value Area High (VAH) and Value Area Low (VAL) defining a configurable percentage (default 70%) of total volume, and High Volume Nodes (HVN) indicating volume above an average threshold. The indicator presents these elements as a histogram on either side of the range, with customizable rows, colors, opacity, and the option to extend lines to the right. Visual elements include yellow horizontal lines for POC, blue dashed lines for VAH and VAL, orange bars for HVN, and shaded regions for the value area. FRVP works on any timeframe and symbol without repainting, providing a stable overlay for volume analysis. Typical use cases involve identifying key volume levels for entries, exits, and profit targets, as well as understanding volume distribution and combining with other indicators for confluence. The indicator supports extensive visual and profile parameter customization to suit individual trading preferences.
Profil indikator
Kategori indikator
Volum
Jenis output
Visualisasi
Keperluan data
Bar sahaja
Data tick
Volum
Isyarat yang disokong
Kekuatan trend
Kemeruapan
Pembalikan
Terobosan
Julat pembukaan sesi
Sentuhan paras
Pecahan paras
Persilangan

Ulasan pelanggan

0.0
Ulasan: 0
Ulasan pelanggan
Belum ada ulasan untuk produk ini. Anda sudah mencuba produk tersebut? Jadilah yang pertama untuk berkongsi pendapat anda!

Perbincangan

Soalan Lazim

Key Levels
Imbalance
Volume
Produk yang tersedia melalui cTrader Store, termasuk bot dagangan, indikator dan plugin, disediakan oleh pembangun pihak ketiga dan diberikan akses untuk tujuan maklumat dan teknikal sahaja. cTrader Store bukan broker dan tidak memberikan nasihat pelaburan, syor peribadi atau sebarang jaminan prestasi masa hadapan.

Lebih banyak produk daripada penulis ini

Indikator
ATR
RSI
+5
Free swing detector with Fibonacci retracement and RSI overlay. Auto-deviation adapts to any timeframe
cBot
ATR
Wedge
+5
15 YEARS RESULTS :Win rate:93% | ROI+19000% | Trades:87,000 | Profit Factor 1.2 | Currency Pairs:22 | $10k to 500k$ |
1.2
Faktor keuntungan
Indikator
ATR
BOS
+5
Heat intensity mapping of structural participation. See where price fights, where it accepts, and where it rejects .
Indikator
RSI
Volume
+3
Auto-detects swings, Includes POC, Value Area (VAH/VAL), High Volume Nodes (HVN), Fibonacci retracement, and RSI overlay

Anda juga mungkin suka

Indikator
MCDX is a powerful and innovative indicator.
Indikator
Key Levels
Support & Resistance
Draws a colored High/Low/Open/Close box for any custom time range you set β€” trade breakouts & retests.
Indikator
Forex
BTCUSD
+10
🎯Smart Signals : Auto Buy/Sell alerts with dynamic TP/SL algorithm. πŸ’‘
Indikator
Allow trader to draw multi trendlines in different timeframes on one chart,Give trader an overview of the current market
Indikator
BOS
CHOCH
+5
BOS/CHoCH signals confirmed by liquidity sweep + FVG confluence, with a live conviction score.
Indikator
AI
ATR
+27
VolumeProfileSuite is an advanced and flexible Volume Profile indicator for cTrader.
Indikator
Fibonacci
Key Levels
+5
Institutional Nasdaq-100 Auto-Fib Playbook for cTrader. Dynamic ICT 70.5% OTE Engine, NY Session Tracker, Real-Time Poin
Indikator
RSI
MACD
Unlock market insights with our Multi-Timeframe Market Levels indicator, enhancing your trading strategies effortlessly
Indikator
SMC
Forex
+5
Pinpoint FVGs, track fills and see mitigation stats β€” trade imbalances with clarity and confidence.
Indikator
MACD
Forex
+5
πŸš€ MACD Pro Trader – Advanced MACD with buy/sell signals, custom MAs & color-coded histograms for smarter trading! πŸ“ˆπŸ”₯
Indikator
Fisher Transform with smoothing. Spot reversals and cycles with precision. Great for any market, any timeframe.
Indikator
AI
ATR
+20
Buy and Sell Signals
Indikator
ATR
RSI
+5
Gold Emperor: AI-driven XAUUSD dominance. Dynamic pivots, matrix trend logic, and institutional shield protection.
Indikator
AI
Grid
+17
Clean 3D, Sleek Candles for Trend Patterns.
Indikator
Prop
Forex
+13
Identifies market compression zones and explosive Breakout moments using mathematical modeling.
Indikator
Doji
Engulfing
+3
Multi Timeframe OHLC levels (daily, weekly, and monthly), with a two-day price action bias dashboard
Indikator
Engulfing
Fibonacci
+4
Six higher-timeframe candle sets on one chart, with liquidity sweep detection and swept levels.
Indikator
Forex
BTCUSD
+11
Visualize trends with Standard Deviation Channel! Display median, and add customizable upper/lower deviation channels.

Harga

Sejak 14/01/2025
2
Jualan
143
Pemasangan percuma




























