
Penerangan
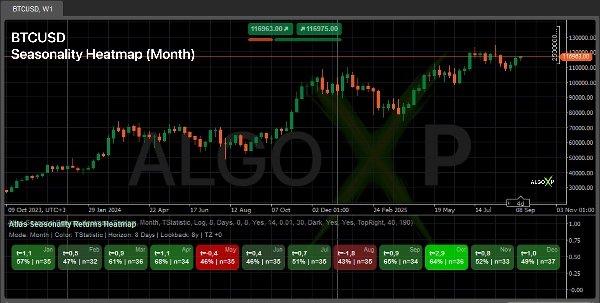
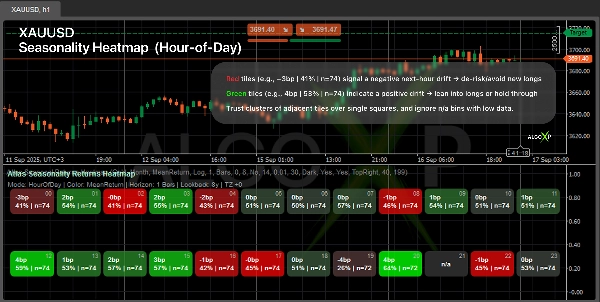
🧭 Masa dagangan anda mengikut jam: Atlas mendedahkan bila pasaran cenderung bergerak mengikut bulan, hari dalam minggu, dan jam. 🧭
Lihat bila pasaran anda cenderung bergerak — mengikut Bulan, Hari dalam Minggu, atau Jam dalam Hari.
Atlas mengira pulangan hadapan dalam jangka masa yang anda pilih dan melukis peta haba simetri (Turun → Sifar → Naik). Setiap petak menunjukkan metrik (Purata, T-stat, atau Sharpe) serta peratusan kejayaan% | n. Gunakannya untuk menentukan masa masuk/keluar, merancang sesi, dan menapis risiko.
🎯 Kenapa pedagang menggunakannya
- Kenal pasti tingkap hijau untuk mengambil posisi dan tingkap merah untuk berundur.
- Rancang sesi mengikut jam/hari yang menguntungkan secara statistik.
- Tambah lapisan “bila” yang jelas kepada strategi bersistem dan bersistematik.
⚙️ Cara ia berfungsi
- Melihat ke hadapan dalam tempoh yang anda pilih dan meringkaskan bagaimana harga cenderung berkelakuan dalam tempoh itu.
- Mengelompokkan keputusan ke dalam baldi masa (Bulan / Hari dalam Minggu / Jam) dan menghormati zon waktu anda.
- Menggunakan perlindungan anomali dan skor kekuatan yang kukuh bagi setiap baldi (serta saiz sampel).
- Melukis peta haba seimbang di sekitar neutral menggunakan warna Naik / Sifar / Turun anda.
👥 Untuk siapa ia
- Pedagang bersistem — masa dan saiz yang lebih baik mengikut sesi.
- Pembina sistem & bot — lapisan penapis masa / saiz masa untuk strategi.
- Pedagang kripto & indeks — corak tingkah laku pantas mengikut hari/jam.
- Pemula — bacaan mudah: lebih hijau = bias positif lebih tinggi dalam jangka masa yang anda pilih.
🚀 Mula cepat
- Pilih Pratetap Aset (Forex/Kripto/Indeks/Emas).
- Tetapkan Horizon (contohnya, 1 Jam untuk HOD, 1 Hari untuk DOW/Bulan).
- Laraskan Jangkaan Kembali, Pemerhatian Minimum, dan warna.
- Baca kelompok (beberapa petak hijau/merah bersebelahan) untuk petunjuk terkuat.
ℹ️ Musiman bukan jaminan hasil masa depan. Ia adalah corak statistik yang bergantung pada tempoh dan metodologi. Gunakan penunjuk ini sebagai konteks untuk peraturan masuk/keluar dan pengurusan risiko anda, uji ketahanan merentasi beberapa jangkaan kembali, dan elakkan bergantung pada bin dengan n rendah (saiz sampel).
Ringkasan
The indicator supports multiple asset presets including Forex, Crypto, Indices, and Commodities, and respects the user’s timezone. It applies outlier protection and calculates a robust strength score per time bucket to ensure reliable insights. Users can customize parameters like lookback period, minimum observations, and color schemes.
Atlas is suitable for discretionary traders seeking better timing and sizing, system and bot builders needing a time-based filter or sizing layer, crypto and index traders analyzing behavioral patterns, and beginners looking for a straightforward indication of positive or negative market bias. It provides a statistical context for entry/exit decisions and risk management but should be used alongside other analysis tools.
Ulasan pelanggan
5 | 50 % | |
4 | 50 % | |
3 | 0 % | |
2 | 0 % | |
1 | 0 % |


