
RSI Advanced
مؤشر
1 عمليات الشراء
الإصدار 1.0، Apr 2026
Windows, Mac
5.0
التقييمات: 1

الوصف
مؤشر القوة النسبية القياسي (RSI) هو واحد من أكثر المؤشرات شعبية في العالم، لكن رسم خط واحد في أسفل الرسم البياني الخاص بك هو طريقة قديمة للتداول. يجعل من الصعب اكتشاف تحولات الزخم الحقيقية، والتسارع، وتقلبات السوق.
الRSI Advanced يعيد اختراع هذا المؤشر الكلاسيكي بالكامل. من خلال تقديم خط إشارة، وترشيح التقلبات، ورسم ذكي للرسم البياني، يحول مؤشر RSI إلى لوحة شاملة ومتكاملة لقياس الزخم وتتبع الاتجاه.
الميزات الرئيسية
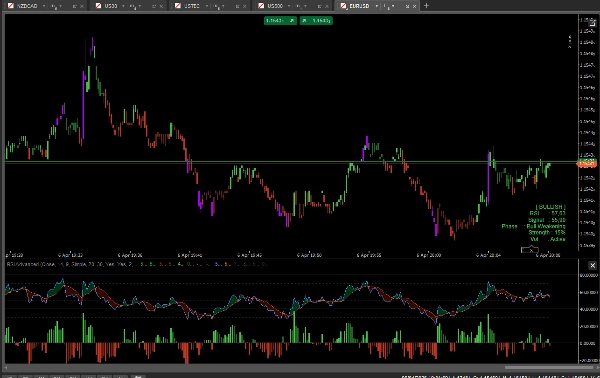
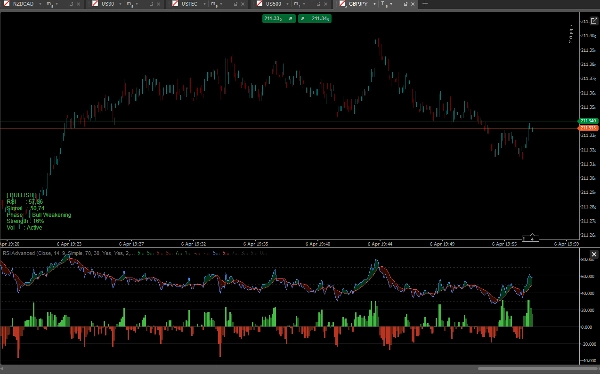
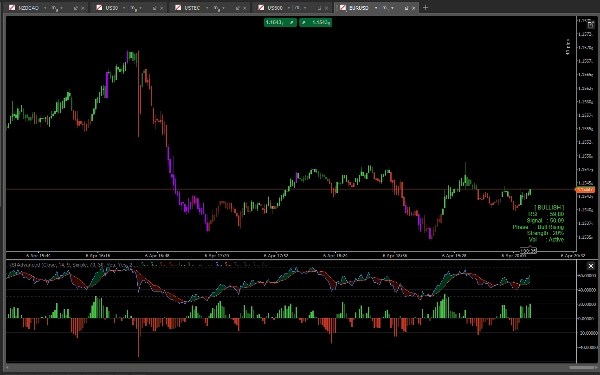
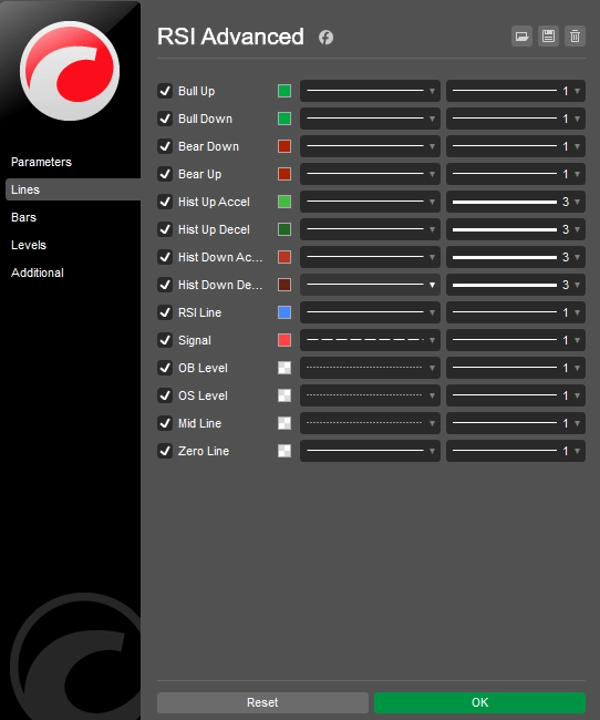
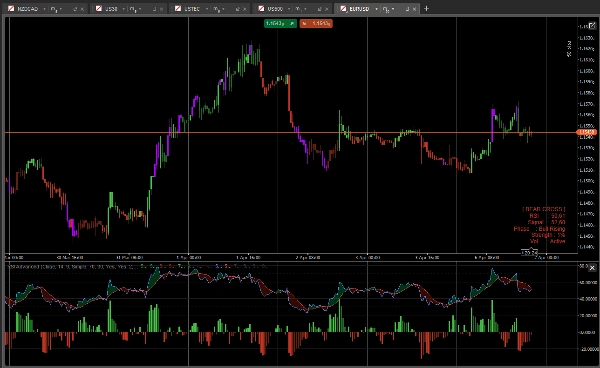
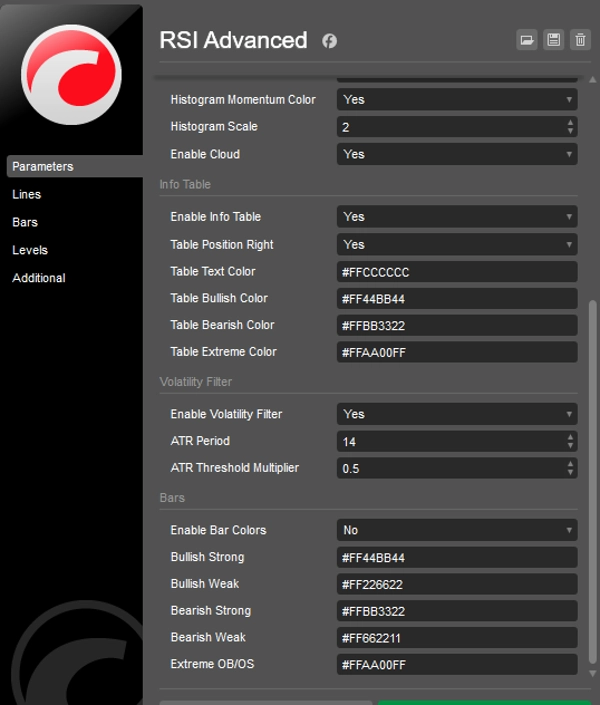
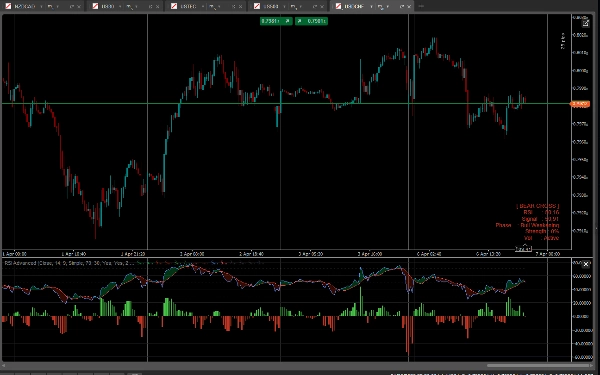
- RSI وسحابة الإشارة: أضفنا متوسط متحرك (خط الإشارة) إلى مؤشر RSI. المساحة بين RSI وخط الإشارة مملوءة بسحابة ديناميكية. إذا كانت السحابة خضراء، فإن الثيران يقودون الزخم. وإذا كانت حمراء، فإن الدببة هم المسيطرون.
- مخطط الزخم: مخطط مركزي يتتبع المسافة الدقيقة بين RSI وخط الإشارة. مع ألوان التسارع/التباطؤ المدمجة (الفاتح مقابل الداكن)، يمكنك توقع التقاطعات ونفاد الزخم قبل حدوثها.
- تلوين الأعمدة الذكي (Paintbars): ستتغير ألوان الشموع بناءً على زخم RSI الأساسي:
-
- أخضر/أحمر فاتح: توافق قوي صعودي/هبوطي (RSI > 50 و RSI > خط الإشارة).
- أخضر/أحمر داكن: زخم ضعيف أو تراجعات.
- بنفسجي/ماجنتا: مستويات تشبع شراء/تشبع بيع قصوى – تحذير من احتمالية الانعكاسات.
- مرشح التقلب الذكي (ATR): هل سئمت من التذبذب في الأسواق المسطحة؟ قم بتمكين مرشح ATR المدمج. عندما ينخفض التقلب تحت المتوسط التاريخي الخاص بك، تتحول الشموع والمخطط إلى اللون الرمادي، مما يبقيك بعيدًا عن الصفقات السيئة.
- لوحة معلومات على الرسم البياني: تعرض لوحة بيانات أنيقة مقاييس الوقت الحقيقي: قيم RSI وخط الإشارة الدقيقة، مرحلة الزخم، نسبة قوة الاتجاه، وحالة التقلب.
- مفتوح بالكامل: تداول على أي رمز (فوركس، عملات رقمية، مؤشرات، أسهم) وعلى أي إطار زمني بدون أي قيود. وصول مدى الحياة.
كيف تتداول به؟
- استمرار الاتجاه: ابحث عن التراجعات حيث يبقى RSI فوق خط المنتصف 50، لكنه ينخفض قليلاً إلى خط الإشارة. عندما يتسارع المخطط (أخضر فاتح) وتتحول الشموع إلى أخضر فاتح، فهذا دخول قوي لاستمرار الاتجاه.
- الانعكاسات: عندما تتحول الشموع إلى اللون البنفسجي (تشبع شراء/بيع قصوى)، انتظر حتى يعبر RSI مرة أخرى فوق خط الإشارة (تتغير لون السحابة) لإعداد انعكاس عالي الاحتمالية.
- تجنب التذبذب: إذا حول مرشح التقلب أعمدتك إلى اللون الرمادي، فقط انتظر بصمت حتى يستيقظ السوق.
الملخص
ملف تعريف المؤشر
فئة المؤشر
التقلب
نوع المخرجات
فلتر
متطلبات البيانات
أعمدة السعر فقط
الإشارات المدعومة
تقاطع
قوة الاتجاه
التقلب
تقييمات العملاء
5.0
التقييمات: 1
5 | 100 % | |
4 | 0 % | |
3 | 0 % | |
2 | 0 % | |
1 | 0 % |
تقييمات العملاء
April 11, 2026
The first thing that worked was timing feels less random, and a small account test feels safer.
مناقشة
الأسئلة الشائعة
BTCUSD
Forex
Signal
Indices
EURUSD
Commodities
GBPUSD
NZDUSD
RSI
AI
XAUUSD
NAS100
ATR
USDJPY
يتم توفير المنتجات المتاحة من خلال cTrader Store، بما في ذلك روبوتات التداول والمؤشرات والإضافات، من قبل مطوري الطرف الثالث وإتاحتها لأغراض الوصول المعلوماتي والفني فقط. cTrader Store ليس وسيطًا ولا يقدم نصائح استثمارية أو توصيات شخصية أو أي ضمان للأداء المستقبلي.


السعر
24
المبيعات
662
التثبيتات المجانية