


คำอธิบาย
TP_SL เครื่องมือความเสี่ยง & ผลตอบแทนที่มีประโยชน์มาก (สไตล์ TradingView)
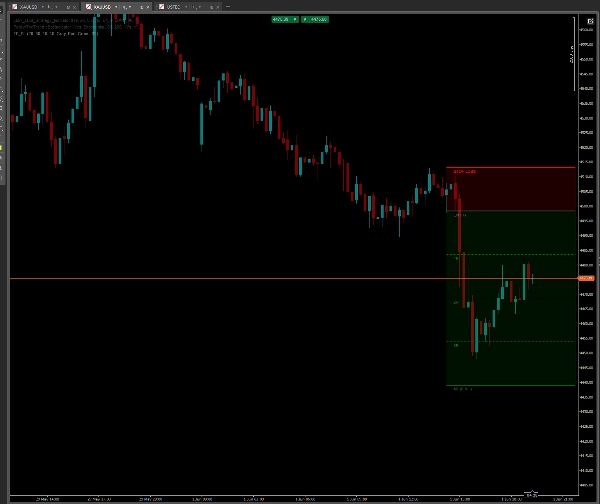
นำเครื่องมือสถานะ Long/Short สไตล์ TradingView สุดยอดมาไว้ในชาร์ต cTrader ของคุณโดยตรง!
ถ้าคุณเคยพลาดเครื่องมือวาดภาพที่รวดเร็ว ใช้งานง่าย และโต้ตอบได้เพื่อวางแผนการเทรดของคุณ คำนวณความเสี่ยง และแสดงระดับ Take Profit อย่างชัดเจน ตัวบ่งชี้นี้เหมาะสำหรับคุณ ออกแบบมาเพื่อความรวดเร็วและความสวยงามของชาร์ต ทำให้คุณสามารถวางแผนการเทรดได้ในเวลาไม่ถึงวินาที
🔥 คุณสมบัติหลัก:
- ประสบการณ์ TradingView ใน cTrader: เลียนแบบเครื่องมือสถานะ Long/Short ที่ได้รับความนิยมอย่างกว้างขวาง
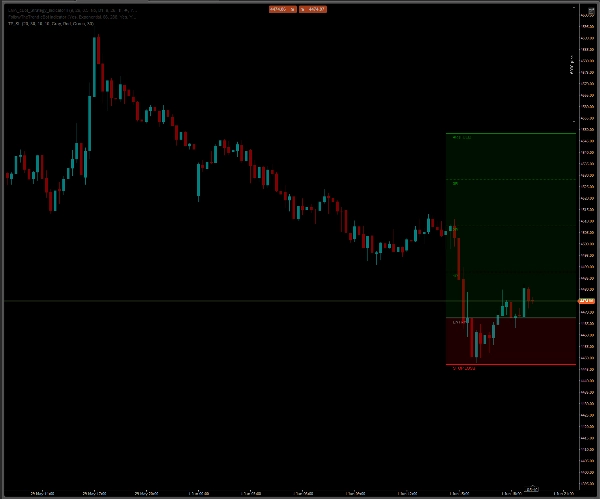
- Smart Auto-Flip (Long/Short): สลับระหว่างสถานะ Long และ Short ได้อย่างราบรื่น เพียงลากเส้น Stop Loss ขึ้นเหนือเส้น Entry ของคุณ และโซน Take Profit จะพลิกไปทางด้านล่างทันที
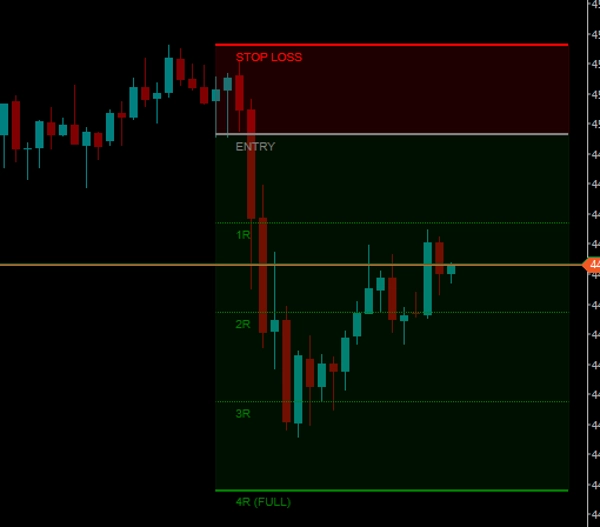
- คำนวณความเสี่ยงอัตโนมัติ (R-Math): คำนวณความเสี่ยงของคุณ (1R) โดยอัตโนมัติตามระยะห่างระหว่าง Entry และ Stop Loss และแสดงระดับ Take Profit ที่แม่นยำสำหรับ 1R (ความเสี่ยงฟรี), 2R, 3R และ 4R (TP เต็ม)
- เทคโนโลยีชาร์ตที่สะอาด: แตกต่างจากเส้นแนวนอนมาตรฐานที่ลากไปทางซ้ายไม่จำกัดและทำให้ข้อมูลประวัติยุ่งเหยิง เครื่องมือนี้ใช้เส้นที่มีขอบเขต สร้างบล็อกที่เรียบร้อยและอยู่ในตำแหน่งที่คุณต้องการอย่างแม่นยำ
- ติดตามราคาที่เปลี่ยนแปลงได้: เมื่อแท่งเทียนใหม่ปรากฏ เครื่องมือจะ "ลอย" ไปทางขวาโดยอัตโนมัติ อยู่ใกล้กับราคาปัจจุบัน
⚡ วิธีใช้งาน:
- วาด: กดปุ่ม SHIFT ค้างไว้และ คลิกซ้าย ที่ใดก็ได้บนชาร์ต การตั้งค่าจะปรากฏขึ้นทันที
- ปรับ: เพียงแค่ ลากและวาง เส้น "ENTRY" สีเทาหรือเส้น "STOP LOSS" สีแดงไปยังระดับราคาที่คุณต้องการ ตารางทั้งหมดจะคำนวณและปรับแบบเรียลไทม์
- ลบ: คลิกที่เส้น Entry หรือ Stop Loss แล้วกดปุ่ม Delete บนแป้นพิมพ์ของคุณ ตัวบ่งชี้มีฟังก์ชันทำความสะอาดอัตโนมัติที่จะลบภาพวาดทั้งหมดทันทีโดยไม่เหลือร่องรอย
⚙️ การตั้งค่าที่ปรับแต่งได้เต็มที่:
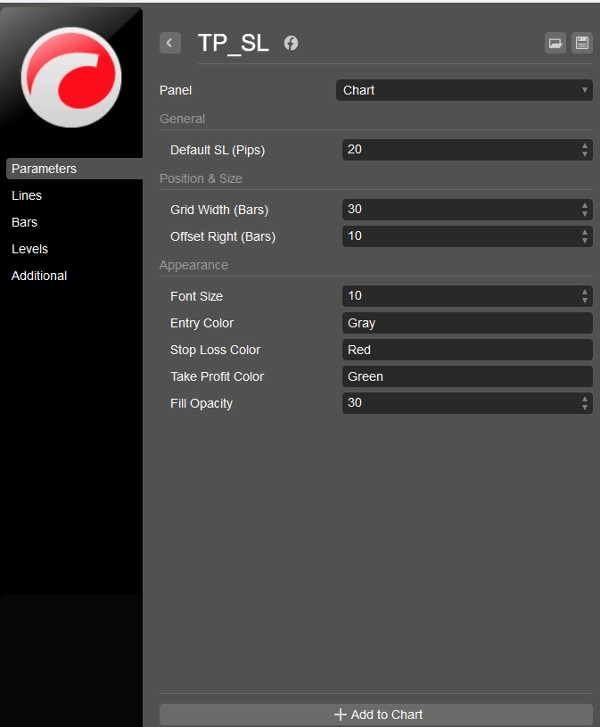
- ความกว้างและการเลื่อนของกริด: ปรับความยาวของเครื่องมือ (ในจำนวนแท่งเทียน) และความใกล้ชิดกับราคาปัจจุบัน
- ภาพลักษณ์: ควบคุมสีได้เต็มที่ พิมพ์ชื่อสีมาตรฐานใดก็ได้ (เช่น DodgerBlue, Orange, Gray) สำหรับเส้น Entry, SL และ TP
- ความทึบแสง: ปรับความโปร่งใสของโซนพื้นหลัง (ตั้งแต่ 0 ถึง 255) เพื่อให้ดูเหมือนกระจกที่เรียบหรู
- ขนาดตัวอักษร: ทำให้ป้ายบนชาร์ตพอดีกับความละเอียดหน้าจอของคุณ
หยุดเดาเป้าหมายของคุณ วางแผนการเทรดอย่างชัดเจน เคารพการจัดการความเสี่ยงของคุณ และรักษาชาร์ตให้สะอาดอย่างสมบูรณ์แบบ!
ตัวบ่งชี้นี้ฟรีสำหรับชุมชน cTrader อย่างสมบูรณ์
สรุป
AI summary
TP_SL is a visual risk and reward indicator designed for cTrader that replicates the TradingView-style Long/Short position tool. It enables traders to quickly and intuitively plan trades by drawing and adjusting entry, stop loss, and take profit levels directly on the chart. The tool automatically calculates risk multiples (1R, 2R, 3R, 4R) based on the distance between entry and stop loss, projecting precise take profit zones.
Key features include a smart auto-flip function that switches between long and short positions by dragging the stop loss line above or below the entry line, clean bounded lines that avoid cluttering historical data, and dynamic price tracking that keeps the tool aligned with current price action. Users can draw the setup by holding SHIFT and left-clicking, then adjust levels with drag-and-drop, and delete the drawing with a single key press.
The indicator offers full customization of grid width, offset, colors, opacity, and text size to fit individual chart preferences. It supports visualization on bar-based data and is categorized under pattern indicators with a focus on key levels. TP_SL aims to facilitate precise trade planning and risk management while maintaining clean chart aesthetics.
Key features include a smart auto-flip function that switches between long and short positions by dragging the stop loss line above or below the entry line, clean bounded lines that avoid cluttering historical data, and dynamic price tracking that keeps the tool aligned with current price action. Users can draw the setup by holding SHIFT and left-clicking, then adjust levels with drag-and-drop, and delete the drawing with a single key press.
The indicator offers full customization of grid width, offset, colors, opacity, and text size to fit individual chart preferences. It supports visualization on bar-based data and is categorized under pattern indicators with a focus on key levels. TP_SL aims to facilitate precise trade planning and risk management while maintaining clean chart aesthetics.
โปรไฟล์อินดิเคเตอร์
หมวดหมู่อินดิเคเตอร์
รูปแบบ
ประเภทเอาต์พุต
การแสดงเป็นภาพ
ข้อกำหนดด้านข้อมูล
แท่งเท่านั้น
รีวิวจากลูกค้า
0.0
รีวิว: 0
รีวิวจากลูกค้า
ยังไม่มีรีวิวสำหรับผลิตภัณฑ์นี้ หากเคยลองแล้ว ขอเชิญมาเป็นคนแรกที่บอกคนอื่น!
การสนทนา
คำถามที่พบบ่อย
Key Levels
ผลิตภัณฑ์ที่มีให้บริการผ่าน cTrader Store รวมถึงบอทการเทรด อินดิเคเตอร์ และปลั๊กอิน มีให้บริการโดยนักพัฒนาบุคคลที่สามและมีไว้เพื่อวัตถุประสงค์ในการเข้าถึงข้อมูลและทางเทคนิคเท่านั้น cTrader Store ไม่ใช่โบรกเกอร์และไม่ได้ให้คำแนะนำการลงทุน คำแนะนำส่วนบุคคล หรือการรับประกันผลการดำเนินงานในอนาคต




























ราคา
32
การขาย
980
ติดตั้งฟรี