
Penerangan
═══════════════════════════════════════════════════════════════
EMA MTF TREND PRO — Penunjuk Analisis Trend Pelbagai Jangka Masa
Penunjuk Lapisan cTrader
═══════════════════════════════════════════════════════════════
Lihat gambaran penuh trend merentasi 6 jangka masa — dalam satu jadual,
pada satu carta, tanpa menukar tetingkap.
───────────────────────────────────────────────────────────────
APA YANG DILAKUKANNYA
───────────────────────────────────────────────────────────────
EMA MTF Trend Pro menggabungkan arah trend EMA, struktur saluran Wilder
struktur, tahap Kijun-sen, kekuatan ADX, isyarat silang,
dan keletihan momentum ke dalam satu papan pemuka langsung.
Setiap baris dalam jadual adalah jangka masa yang berbeza. Setiap lajur
menjawab soalan yang berbeza tentang jangka masa itu. Sekilas pandang
memberitahu anda sama ada jangka masa bersetuju — dan sama ada selamat untuk
masuk.
───────────────────────────────────────────────────────────────
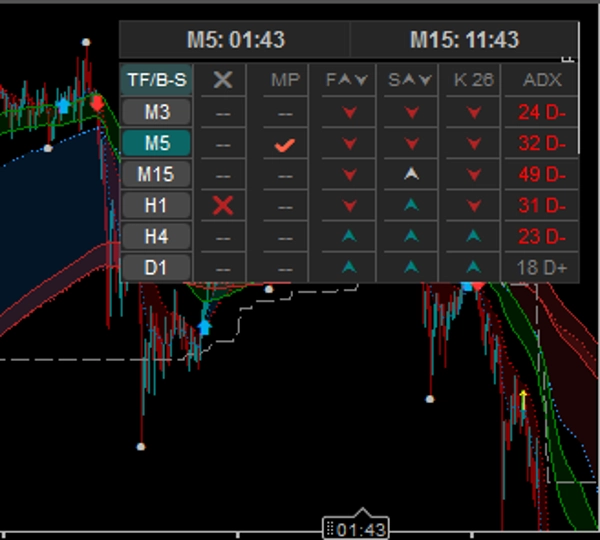
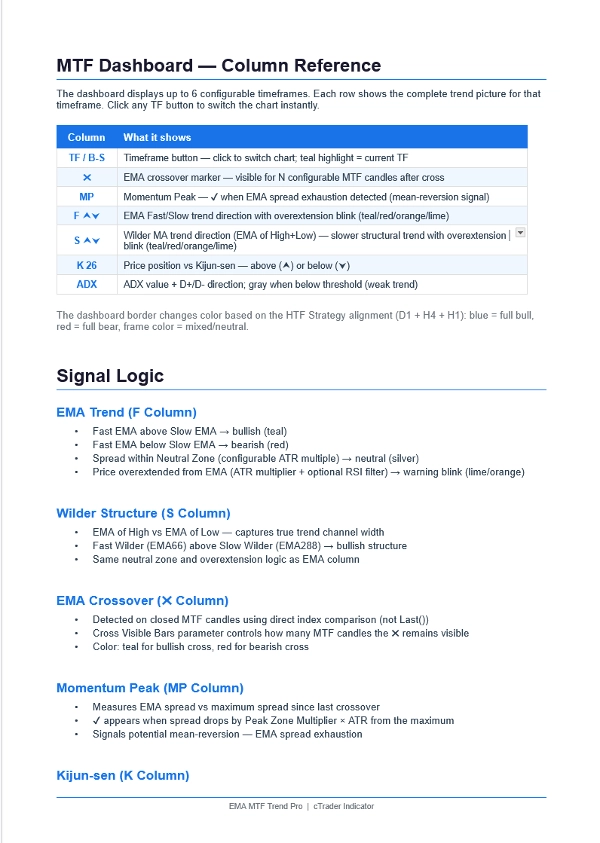
PAPAN PEMUKA — 6 JANGKA MASA × 7 LAJUR
───────────────────────────────────────────────────────────────
Lajur Apa yang ditunjukkan
──────── ──────────────────────────────────────────────────
TF/B-S Butang jangka masa — klik untuk menukar carta dengan segera
Sorotan teal = jangka masa yang sedang dipaparkan
✖ Silang EMA — kelihatan untuk N lilin yang boleh dikonfigurasi
Teal = silang bullish | Merah = silang bearish
MP Puncak Momentum — ✔ apabila penyebaran EMA habis
Isyarat amaran pembalikan purata
F ⮝⮟ Arah trend EMA Pantas vs Perlahan
Teal = naik | Merah = turun | Perak = neutral
Berkelip apabila harga terlalu jauh dari EMA
S ⮝⮟ Struktur MA Wilder (EMA Tinggi/Rendah)
Penapis trend yang lebih perlahan dan lebih struktural
K 26 Harga vs Kijun-sen
⮝ = harga di atas (sokongan) | ⮟ = di bawah (rintangan)
ADX Kekuatan trend + arah D+/D-
Kelabu = pasaran lemah/berkisar (di bawah ambang)
───────────────────────────────────────────────────────────────
CIRI-CIRI
───────────────────────────────────────────────────────────────
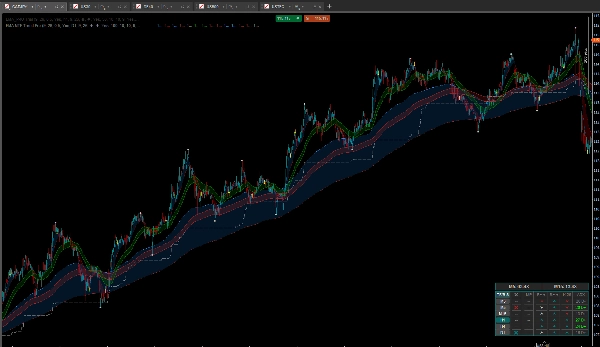
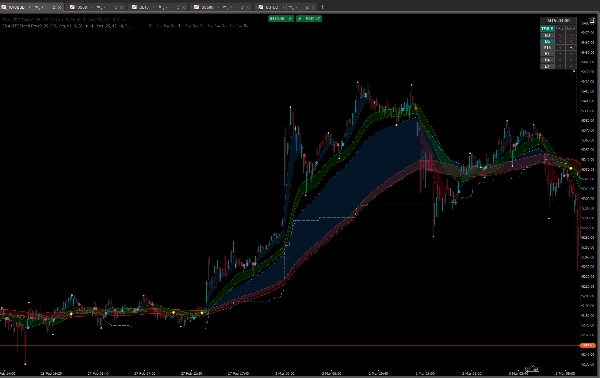
SISTEM AWAN EMA
• EMA Pantas + Perlahan dengan isian awan berwarna
• Pengesanan zon neutral (pemboleh gandaan ATR boleh dikonfigurasi)
• Amaran keterlaluan dengan penapis RSI
LAPISAN EMA MTF
• Projekkan mana-mana EMA TF lebih tinggi ke carta semasa
• Interpolasi linear — garis licin, tiada langkah
• Anak panah silang dengan simbol dan warna boleh dikonfigurasi
• Sembunyikan anak panah lapisan secara automatik apabila TF lebih tinggi dipilih
dalam papan pemuka (mengelakkan kekacauan visual)
TINGGI & RENDAH AYUN
• Titik SH / SL bergilir-gilir — tiada tinggi berturut-turut berganda
• Label teks SH / SL pilihan dengan penentuan berasaskan ATR
• Saiz titik, saiz label, warna boleh dikonfigurasi
• Togol hidup/mati tunggal untuk paparan ayunan keseluruhan
KIJUN-SEN
• Definisi Hosoda standard (padan dengan TradingView / MT4)
• Tempoh boleh dikonfigurasi
• Juga tersedia sebagai garis lapisan MTF pada carta
PITA MA-WILDER
• EMA Tinggi dan EMA Rendah — mencipta saluran trend
• Pita Pantas (EMA66) + Pita Perlahan (EMA288)
• Tersedia pada carta dan sebagai lapisan MTF
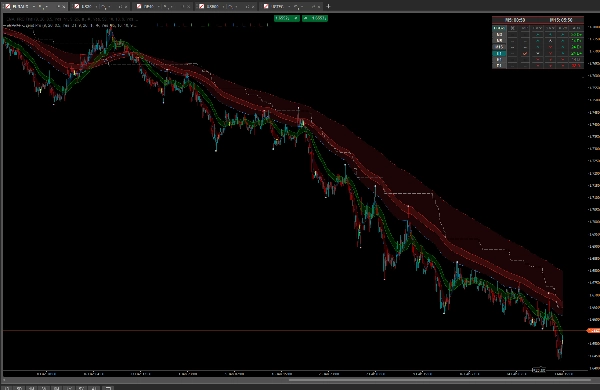
SEMPADAN STRATEGI HTF
• Sempadan papan pemuka menjadi teal apabila D1 + H4 + H1
semua bullish (EMA + Wilder selaras)
• Menjadi merah apabila ketiga-tiganya bearish
• Pengesahan visual segera penyelarasan multi-TF penuh
PEMASA KIRA BALIK LILIN
• Pemasa berganda — mana-mana dua jangka masa
• Pemasa kedua boleh mengikuti TF carta semasa
• Susun atur padat dalam mod satu lajur
MOD PADAT / PENUH
• Klik tajuk TF/B-S untuk togol
• Mod penuh: 7 lajur (semua isyarat)
• Mod padat: 3 lajur (TF, EMA, Wilder) — ruang minimum
───────────────────────────────────────────────────────────────
STRATEGI — CARA MENGGUNAKAN
───────────────────────────────────────────────────────────────
LANGKAH 1 — TETAPKAN BIAS (Jangka Masa Lebih Tinggi)
• Baris D1: F ⮝ + S ⮝ = struktur harian bullish
• Baris H4: arah sama = trend disahkan
• Sempadan papan pemuka menjadi teal = D1 + H4 + H1 semua bersetuju
LANGKAH 2 — CARI MASUKAN (Jangka Masa Lebih Rendah)
• Klik H1 atau M15 dalam jadual untuk menukar carta
• Tunggu silang ✖ dalam arah yang sama dengan bias HTF
• Lajur K menunjukkan ⮝ (harga di atas Kijun) untuk posisi panjang
• Lajur ADX aktif, tidak kelabu (trend mempunyai kekuatan)
LANGKAH 3 — Tapis DENGAN PUNCAK MOMENTUM
• Lajur MP menunjukkan ✔ → penyebaran EMA habis → elakkan masuk
• Tunggu MP hilang (--) sebelum masuk
• Gunakan pada TF lebih rendah untuk mengelakkan masuk pada ekstrem EMA
LANGKAH 4 — GUNAKAN TAHAP AYUN
• Titik SH = ayunan tinggi terkini (rintangan / rujukan hentian)
• Titik SL = ayunan rendah terkini (sokongan / rujukan sasaran)
• Titik bergilir-gilir — sentiasa satu tinggi, satu rendah pada satu masa
───────────────────────────────────────────────────────────────
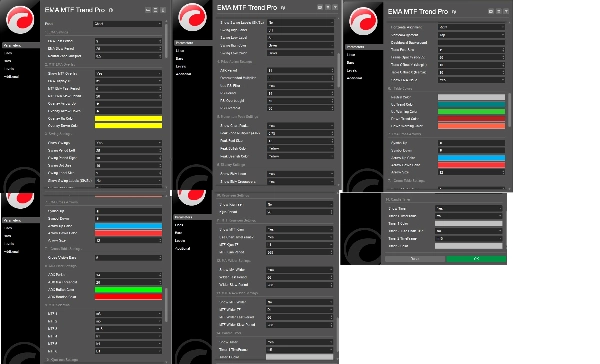
KUMPULAN PARAMETER
───────────────────────────────────────────────────────────────
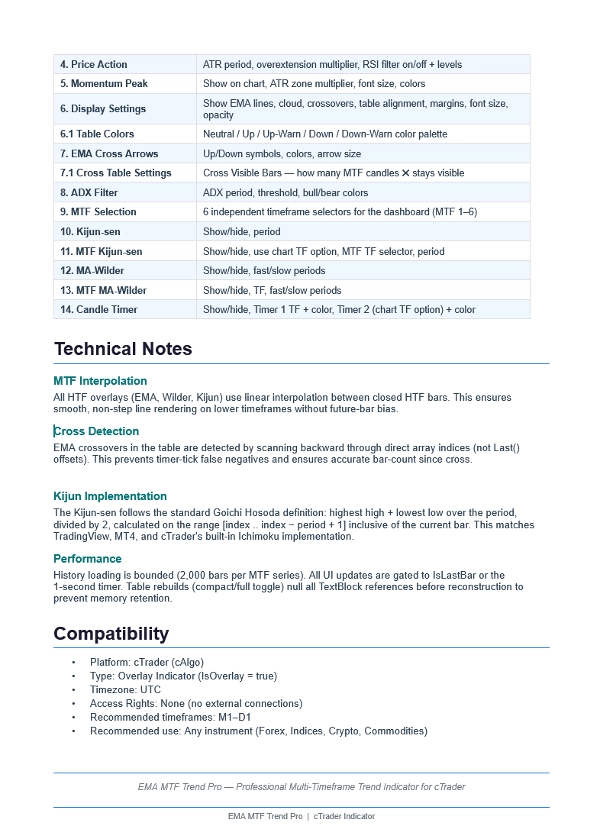
1. Tetapan EMA — tempoh Pantas/Perlahan, zon neutral
2. Lapisan EMA MTF — TF, tempoh, gaya anak panah
3. Tetapan Ayunan — Tunjuk/sembunyi, tempoh, label, warna
4. Tindakan Harga — ATR, keterlaluan, penapis RSI
5. Puncak Momentum — Pemboleh gandaan zon, fon, warna
6. Tetapan Paparan — Garis, awan, susun atur jadual
6.1 Warna Jadual — Kawalan palet warna penuh
7. Anak Panah Silang EMA — Simbol, warna, saiz
7.1 Tetapan Jadual Silang — Bar Silang Kelihatan (N lilin)
8. Penapis ADX — Tempoh, ambang, warna
9. Pemilihan MTF — 6 × pemilih TF bebas
10. Kijun-sen — Tunjuk/sembunyi, tempoh
11. Kijun-sen MTF — TF, tempoh, pilihan TF carta
12. MA-Wilder — Tunjuk/sembunyi, tempoh pantas/perlahan
13. MA-Wilder MTF — TF, tempoh pantas/perlahan
14. Pemasa Lilin — TF, warna, pilihan TF carta
───────────────────────────────────────────────────────────────
Ringkasan
Ulasan pelanggan
5 | 0 % | |
4 | 100 % | |
3 | 0 % | |
2 | 0 % | |
1 | 0 % |


