
Beschreibung
HCCC MTF - Hurst Cycle Composite Channel (100% KOSTENLOS)
Überblick
Der HCCC MTF (Hurst Cycle Composite Channel) ist ein fortschrittliches, vollständig interaktives Multi-Timeframe (MTF) Dashboard und Kanalindikator. Basierend auf den zyklischen Theorien von J.M. Hurst kombiniert mit ATR-Volatilität hilft dieses Tool Ihnen, den wahren Markttrend und die perfekten zyklischen Wendepunkte (Hochs und Tiefs) über mehrere Zeitrahmen gleichzeitig zu identifizieren.
Das zweite ist dem halbautomatischen Handel mit https://ctrader.com/products/3618?u=cLogic
WICHTIG: Dieser Indikator ist komplett 100% KOSTENLOS für alle. Er wurde speziell als ultimativer visueller Begleiter für den "Follow The Trend XAU Edition" cBot entwickelt.
Während Sie ihn perfekt für den manuellen Handel verwenden können, entfaltet sich seine wahre Stärke in einer halbautomatischen Einrichtung: Sie nutzen das HCCC Dashboard, um den Zyklus und das Momentum der höheren Zeitrahmen zu lesen, und aktivieren dann den Follow The Trend XAU Edition cBot, um die Trades in dieser Richtung präzise auszuführen und zu verwalten.
Hauptmerkmale
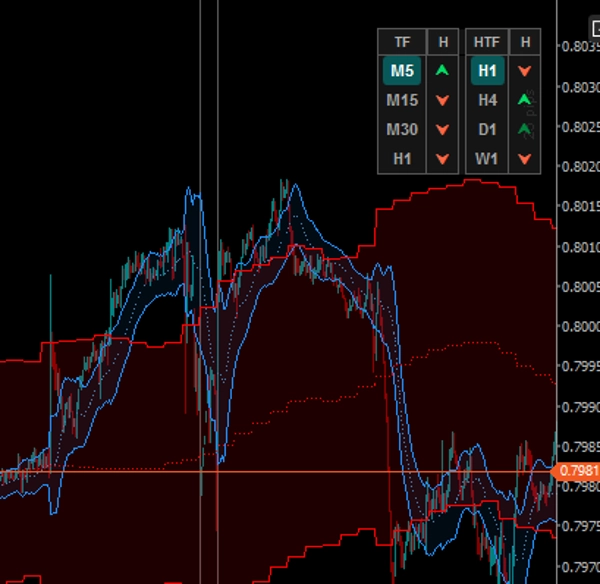
1. Interaktives MTF Dashboard (anklickbar)
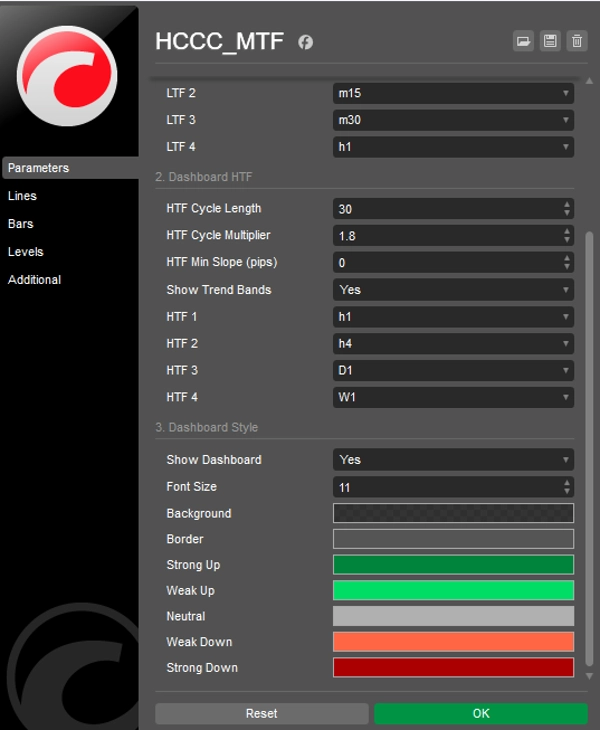
Vergessen Sie das ständige Wechseln zwischen Charts. Das Dashboard auf dem Chart verfolgt 4 niedrigere Zeitrahmen (LTF) und 4 höhere Zeitrahmen (HTF).
- LTF-Schaltflächen: Klicken Sie auf eine beliebige LTF-Schaltfläche, um sofort den Zeitrahmen Ihres aktuellen Charts zu ändern.
- HTF-Schaltflächen: Klicken Sie auf eine beliebige HTF-Schaltfläche, um den Kanal dieses spezifischen höheren Zeitrahmens direkt auf Ihrem aktuellen Chart zu projizieren!
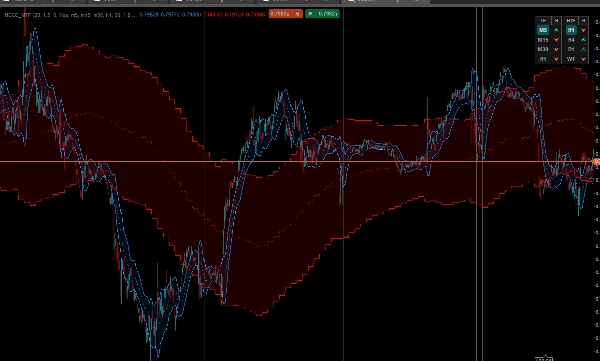
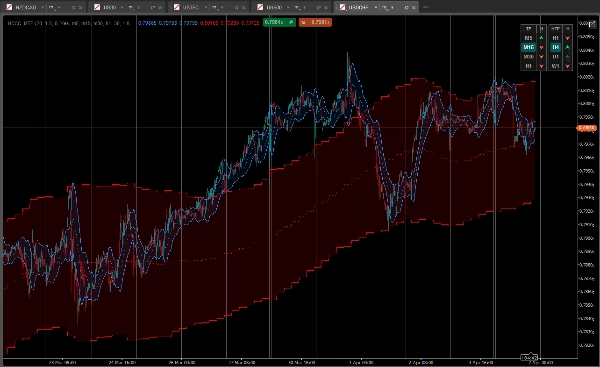
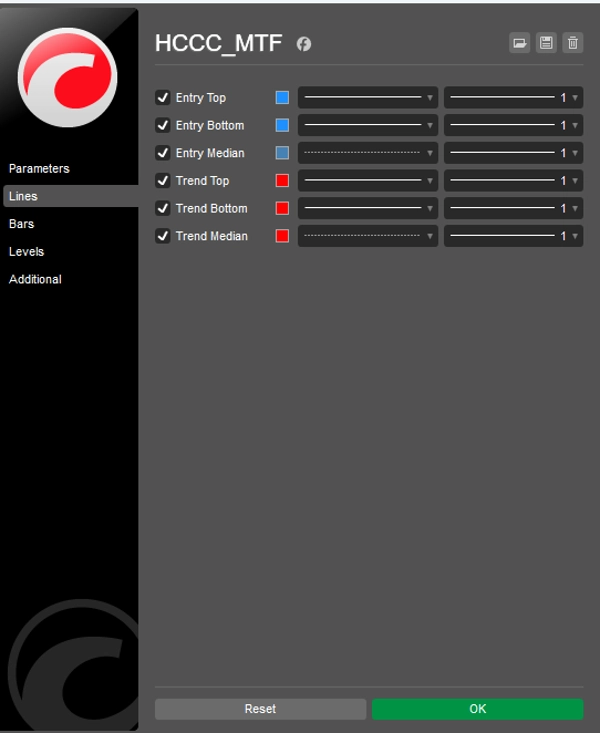
2. Duales Kanal-Overlay-System
Der Indikator zeichnet gleichzeitig zwei elegante, wolkengefüllte Kanäle in Ihrem Chart:
- Einstiegszyklus (blaue Wolke): Berechnet den Hurst-Zyklus basierend auf dem Zeitrahmen Ihres aktuellen Charts.
- Trendzyklus (rote Wolke): Ein Makro-Ansichtskanal, berechnet aus dem höheren Zeitrahmen, den Sie im Dashboard ausgewählt haben.
3. Fortschrittliche 5-Zustands-Zyklus-Signale
Das Dashboard zeigt nicht nur die Trendrichtung; es zeigt die Phase des Zyklus, indem es die Steigung der Medianlinie und die Position des Preises relativ zu den ATR-Bändern analysiert.
- [ ⮝ ] Dunkelgrün (starker Kauf): Die Mediansteigung ist STEIGEND, und der Preis ist auf das untere Band gefallen. Dies ist ein zyklisches Tief (Kaufe den Rücksetzer).
- [ ⮝ ] Hellgrün (schwacher Kauf): Der Trend ist STEIGEND, aber der Preis bewegt sich um das Median- oder obere Band.
- [ — ] Grau (neutral): Der Zyklus ist flach. Kein klarer Impuls.
- [ ⮟ ] Hellrot (schwacher Verkauf): Der Trend ist FALLEND, aber der Preis ist nahe dem Median.
- [ ⮟ ] Dunkelrot (starker Verkauf): Die Mediansteigung ist FALLEND, und der Preis ist zum oberen Band gestiegen. Dies ist ein zyklisches Hoch (Verkaufe die Rallye).
Wie verwendet man es mit dem "Follow The Trend XAU Edition" cBot?
- Schauen Sie auf die rechte Seite des Dashboards (HTF-Spalte). Warten Sie auf eine klare Ausrichtung der höheren Zeitrahmen (z.B. H4 und D1 zeigen dunkel-/hellgrüne Pfeile).
- Schauen Sie auf die linke Seite des Dashboards (LTF-Spalte), um einen lokalen Rücksetzer zu finden (z.B. M15 zeigt einen dunkelgrünen "starken Kauf"-Pfeil).
- Sobald die MTF-Logik übereinstimmt, aktivieren Sie Ihren Follow The Trend XAU Edition cBot in Richtung "KAUF" und lassen Sie seine Algorithmen den Einstieg, Trailing Stops und das Risikomanagement übernehmen.
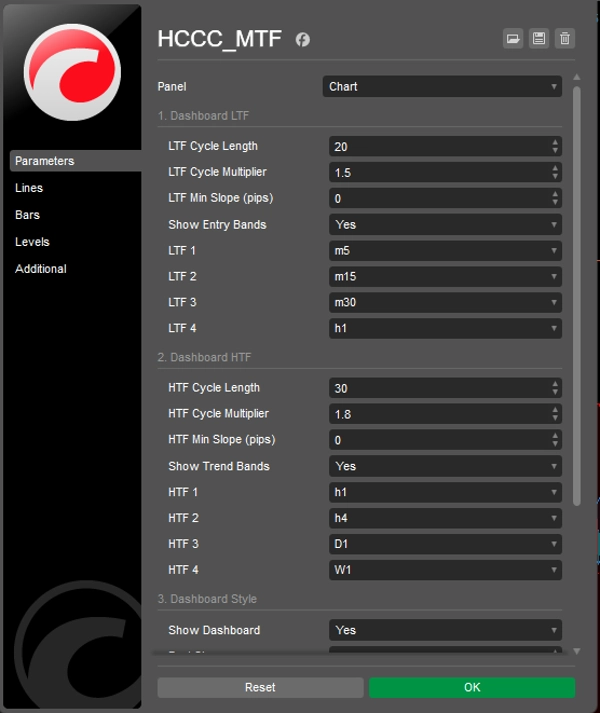
Anpassung
Alles ist vollständig anpassbar: Zykluslängen, ATR-Multiplikatoren, minimale Steigungsempfindlichkeit (in Pips) zur Filterung von Rauschen sowie volle Kontrolle über die UI-Farben und Positionierung.
Laden Sie es jetzt KOSTENLOS herunter und bringen Sie Ihren halbautomatischen Handel auf die nächste Stufe!
Zusammenfassung
It overlays two cloud-filled channels: a blue "Entry Cycle" channel based on the current timeframe and a red "Trend Cycle" channel derived from a selected higher timeframe. The dashboard provides advanced five-state cyclic signals indicating strong or weak buy/sell conditions and neutral phases by analyzing the slope of the median line and price position relative to ATR bands.
The indicator is fully customizable, including cycle lengths, ATR multipliers, slope sensitivity, and UI appearance. It is intended to complement the "Follow The Trend XAU Edition" cBot by providing visual cycle and momentum analysis to guide semi-automated trade execution and management. The HCCC MTF supports various markets including Forex, commodities, indices, stocks, and cryptocurrencies.


![„[Hamster-Coder] Price“-Logo](https://cdn.ctrader.com/image/webp/893fb641-d5b3-44d8-91fb-6a2dc6f3d309_30647)


