

Price Change Bundle 1.0 BT
อินดิเคเตอร์
2 การซื้อ
เวอร์ชัน 1.0, Aug 2025
Windows, Mac
4.0
รีวิว: 1

51
การขาย
1.43K
ติดตั้งฟรี
คำอธิบาย
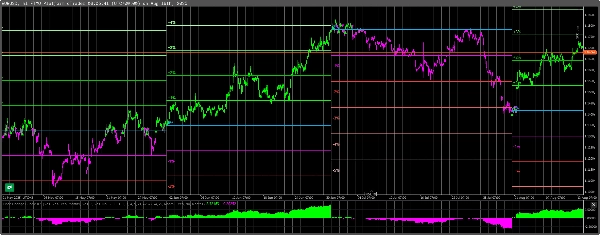
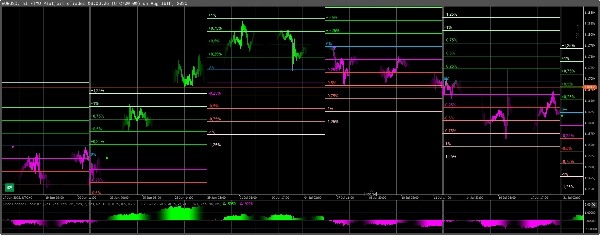
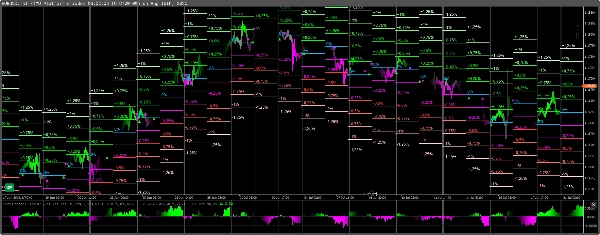
ชุดเปลี่ยนแปลงราคา — 3 ตัวชี้วัด, 1 ตรรกะ.
เครื่องมือจากการตั้งค่าของฉันเอง (อุปทาน & อุปสงค์ + ZigZag แบบกำหนดเอง) สร้างขึ้นเพื่อแสดงให้เห็นว่าราคาขยับอย่างไรจริงๆ รอบการปิด TF ที่สูงกว่า.
สลับเปิด/ปิดโมดูลใดก็ได้ — เปิด/ปิดใช้งาน ระดับ, แท่ง, ฮิสโตแกรม ทีละรายการ.
โมดูล
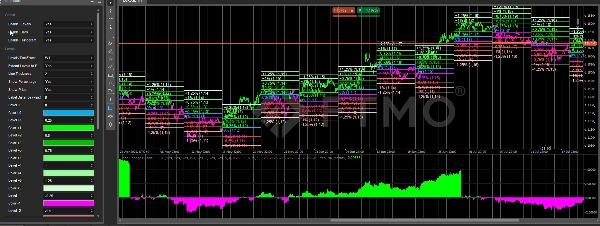
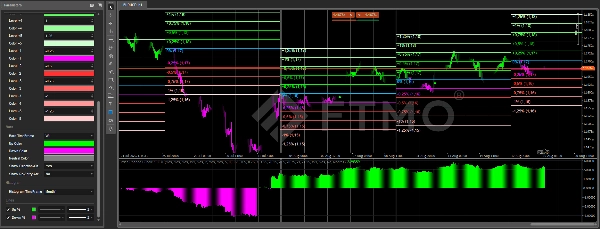
ระดับการเปลี่ยนแปลงราคา
- วาด โซนเปอร์เซ็นต์ (±0.25…±1.25%) ในกรอบเวลาที่เลือก.
- แต่ละโซนถูกวัดจาก เส้นฐาน 0% และแสดง เปอร์เซ็นต์และราคา.
- ตัวเลือกในการ ขยายเส้นไปจนถึงสิ้นสุดช่วงเวลา เพื่อแผนที่รายสัปดาห์/รายเดือนที่ชัดเจน.
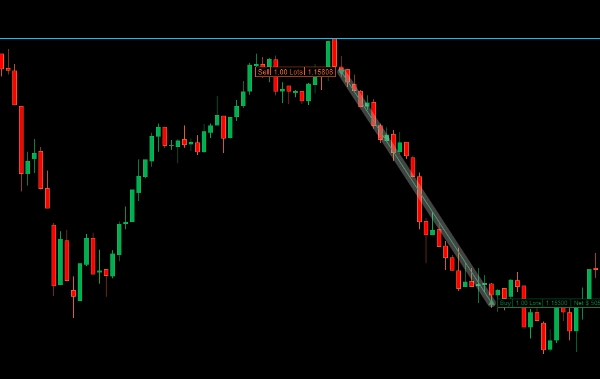
แท่งการเปลี่ยนแปลงราคา
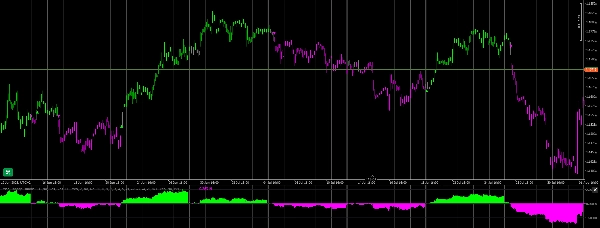
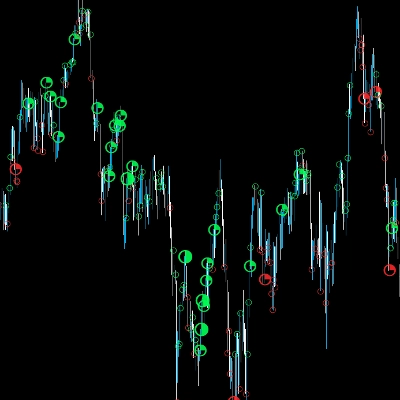
- ระบายสีแท่งเทียนตาม โหมดเต็มบน/ล่าง เทียบกับจุดหมุน TF.
- เหมาะสำหรับใช้เมื่อแท่งปิด เพื่อการเข้าตลาดและอ่านโหมดอย่างรวดเร็ว.
- รวมลูกศร เปลี่ยนทิศทาง & เข้าซ้ำ (หลังจากเป็นกลาง → ด้านเดียวกัน).
ฮิสโตแกรมการเปลี่ยนแปลงราคา
- แสดง การพัฒนาเปอร์เซ็นต์โดยรวม เทียบกับการอ้างอิง TF เดียวกัน (ขึ้น% / ลง%).
- ดีสำหรับการสังเกต การเร่ง/ชะลอ อย่างรวดเร็ว.
ทำไมมันถึงได้ผล — “ความลับของการเคลื่อนไหวราคา”
- มืออาชีพยึดติดกับ การปิดก่อนหน้า ของ TF ที่สูงกว่า (MN/W1/D1).
- ระยะทาง เปอร์เซ็นต์ที่วัดได้ จากจุดยึดนั้นทำหน้าที่เหมือน แม่เหล็ก/เป้าหมาย ที่ใช้งานได้จริง.
- แท่งเทียนที่อยู่ เหนือ/ใต้ จุดหมุนอย่างเต็มที่กำหนด โหมด; การเข้าซ้ำ หลังจากเป็นกลางมักจะดำเนินการเคลื่อนไหวต่อ.
การใช้งานที่ยืดหยุ่น
- เลือกกรอบเวลาใดก็ได้ต่อโมดูล (เช่น, ระดับ MN • แท่ง W1 • ฮิสโตแกรม D1).
- ทำงานบนกราฟทุกประเภท รวมถึง Renko/ช่วง/ติ๊ก (การคำนวณใช้ TF ที่ใช้เวลาที่คุณเลือก).
- ไม่มีการวาดซ้ำ น้ำหนักเบา.
วิดีโอ & การสนับสนุน
- วิดีโอ ทีละขั้นตอน (การติดตั้ง, การตั้งค่าล่วงหน้า, ตัวอย่างการเทรด) จะเผยแพร่ เร็วๆ นี้.
- ผู้ซื้อสามารถติดต่อฉันโดยตรง สำหรับคำถามใดๆ, ความช่วยเหลือในการตั้งค่า หรือข้อเสนอแนะ ฉันตอบกลับด้วยตัวเอง.
สรุป
AI summary
Price Change Bundle 1.0 BT is a composite indicator consisting of three modules—Levels, Bars, and Histogram—designed to analyze price movements relative to higher timeframe closes. It integrates concepts from Supply & Demand and a custom ZigZag to reveal how price behaves around significant reference points.
- Price Change Levels: Displays percentage zones (±0.25% to ±1.25%) from a 0% baseline within a selected timeframe, showing both percentage and price values. Lines can be extended to the period’s end for clear weekly or monthly mapping.
- Price Change Bars: Colors candles based on their position relative to the timeframe pivot, indicating regimes with full above/below coloring. Includes arrows signaling direction changes and re-entries after neutral phases, aiding entry decisions.
- Price Change Histogram: Illustrates overall percentage development (Up%/Down%) against the same timeframe reference, facilitating quick identification of acceleration or slowdowns.
Each module can be toggled on or off independently and configured with different timeframes. The indicator works on any chart type, including Renko, range, and tick charts, using time-based timeframe calculations. It anchors calculations to previous closes of higher timeframes (monthly, weekly, daily) and does not repaint. Buyers have access to direct support from the developer.
- Price Change Levels: Displays percentage zones (±0.25% to ±1.25%) from a 0% baseline within a selected timeframe, showing both percentage and price values. Lines can be extended to the period’s end for clear weekly or monthly mapping.
- Price Change Bars: Colors candles based on their position relative to the timeframe pivot, indicating regimes with full above/below coloring. Includes arrows signaling direction changes and re-entries after neutral phases, aiding entry decisions.
- Price Change Histogram: Illustrates overall percentage development (Up%/Down%) against the same timeframe reference, facilitating quick identification of acceleration or slowdowns.
Each module can be toggled on or off independently and configured with different timeframes. The indicator works on any chart type, including Renko, range, and tick charts, using time-based timeframe calculations. It anchors calculations to previous closes of higher timeframes (monthly, weekly, daily) and does not repaint. Buyers have access to direct support from the developer.
โปรไฟล์อินดิเคเตอร์
รีวิวจากลูกค้า
4.0
รีวิว: 1
5 | 0 % | |
4 | 100 % | |
3 | 0 % | |
2 | 0 % | |
1 | 0 % |
รีวิวจากลูกค้า
February 9, 2026
Price Change Bundle 1.0 BT delivers clear and practical price-change metrics. Best used on M10-H1, where momentum readings stay balanced and meaningful. Great for filtering weak moves, confirming impulse strength and improving intraday timing. A simple but effective companion for momentum-based strategies.
การสนทนา
คำถามที่พบบ่อย
Prop
Forex
Signal
Breakout
Indices
ผลิตภัณฑ์ที่มีให้บริการผ่าน cTrader Store รวมถึงบอทการเทรด อินดิเคเตอร์ และปลั๊กอิน มีให้บริการโดยนักพัฒนาบุคคลที่สามและมีไว้เพื่อวัตถุประสงค์ในการเข้าถึงข้อมูลและทางเทคนิคเท่านั้น cTrader Store ไม่ใช่โบรกเกอร์และไม่ได้ให้คำแนะนำการลงทุน คำแนะนำส่วนบุคคล หรือการรับประกันผลการดำเนินงานในอนาคต






















ราคา
51
การขาย
1.43K
ติดตั้งฟรี