
설명
🎯 다중 시간대 변동성 인텔리전스
변동성 돌파를 놓치지 마세요 - 모든 시간대를 동시에 확인하세요
대부분의 변동성 지표는 한 가지 관점만 보여줍니다. 저희의 다중 시간대 롤링 변동성 지표 는 단기(7), 중기(21), 장기(63) 기간 전반에 걸친 완전한 그림을 제공하며, 정확히 언제 행동해야 하는지 알려주는 내장 거래 신호 를 포함하고 있습니다.
⚡ 다중 시간대 변동성이 모든 것을 바꾸는 이유
단일 시간대 vs 다중 시간대 접근법:
- ❌ 단일 기간: 나무는 보지만 숲을 놓칩니다
- ✅ 세 기간: 맥락을 갖춘 완전한 변동성 풍경
실제 거래 시나리오:
- 단기 급등 동안 장기 안정 → 일시적 잡음 (무시)
- 모든 시간대 상승 → 진정한 체제 변화 (행동)
- 단기 안정 중 장기 혼란 → 거짓 안정 (주의)
🎯 전문가 기능
✨ 세 배 시간대 가시성
- StdDev 7: 즉각적인 변동성 변화를 포착 (일중)
- StdDev 21: 중기 변동성 (스윙 트레이딩)
- StdDev 63: 장기 변동성 맥락 (포지션 트레이딩)
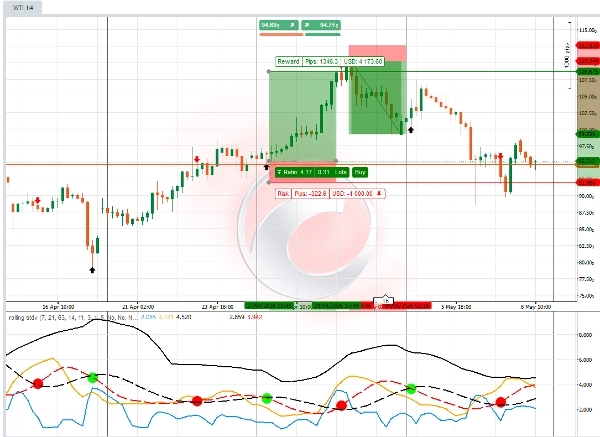
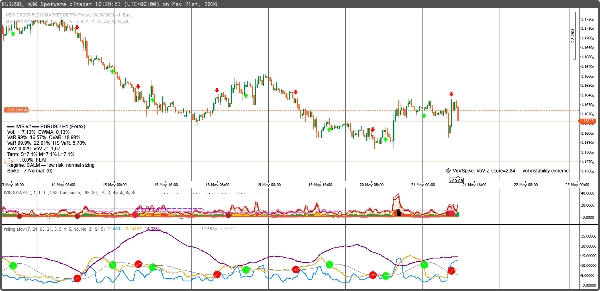
- 오실레이터 신호: 평균 롤링 표준편차 신호선이 교차할 때, 색깔이 있는 점들이 더 높거나 낮은 변동성과 가격 움직임 방향을 확인해 줍니다. 큰 빨간 점, 초록 점 신호와 함께, 트레이더는 차트에서 빨간 화살표, 초록 화살표 신호도 볼 수 있어 진입 수준과 거래 규모 결정을 돕습니다.
- 롤링 표준편차는 예측 시장 신호 논리를 가진 변동성 오실레이터입니다. 패널의 매개변수는 트레이더가 거래하려는 CFD 상품 유형에 맞게 확인하고 조정해야 합니다. 모든 금융 자산 CFD 상품은 약간씩 다른 패널 설정을 가질 수 있습니다. 트레이더는 기울기, 빠른/중간 교차 신호, 평활화 활성화를 통해 변동성 판독의 정확도와 정밀도를 선택할 수 있습니다.
📊 고급 변동성 분석
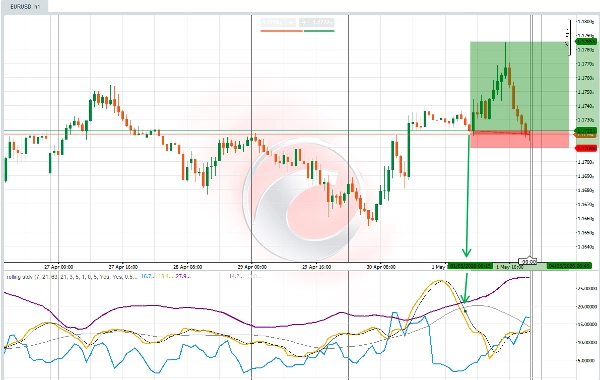
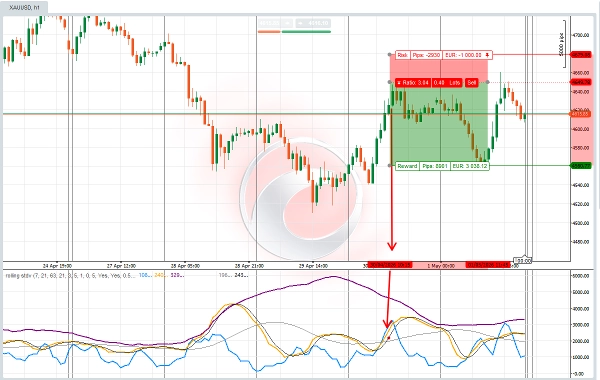
- 변동성 교차: StdDev 선 교차 = 체제 변화
- 평균 회귀 신호: 변동성이 평균으로 돌아옴
- 급등 탐지: 극단적 변동성 이벤트
💡 이 거래 스타일에 완벽합니다:
🎯 변동성 돌파 트레이더
- 폭발적 움직임 전 낮은 변동성 시 진입
- 반전 전 높은 변동성 시 이탈
- 세 번의 확인으로 정확한 진입 타이밍
📈 평균 회귀 트레이더
- 변동성 극단을 자신 있게 반전
- 과도하게 확장된 시장 상태 식별
- 변동성을 반대 지표로 활용
🛡 위험 회피 트레이더
- 높은 변동성 기간 완전히 회피
- 안정적이고 예측 가능한 시장에서만 거래
- 변동성을 포지션 크기 가이드로 사용
📊 옵션 트레이더
- 높은 변동성 시 프리미엄 매도 타이밍
- 변동성 압축 시 옵션 매수
- IV 대 HV 분석으로 오가격 탐지
내장 스마트 신호:
- ✅ 매수 시: 변동성이 임계값 이하로 떨어지거나 이동평균 아래로 교차할 때
- ✅ 매도 시: 변동성이 임계값 이상으로 급등하거나 이동평균 위로 교차할 때
📈 당신이 얻는 것:
✅ 세 배 시간대 가시성 - 더 이상 변동성 맥락을 추측하지 않음
✅ 자동 매수/매도 신호 - 최적 지점에 명확한 시각적 화살표
✅ 변동성 체제 감지 - 시장이 안정적인지 혼란스러운지 파악
✅ 사용자 정의 임계값 - 모든 거래 스타일이나 자산에 맞춤 설정 가능
✅ 전문가용 색상 코딩 - 즉각적인 시각적 이해
💰 특별 출시 가격: $50
(정상 가격: $100)
가치 분해:
- StdDev 7 지표: $29 가치
- StdDev 21 지표: $29 가치
- StdDev 63 지표: $29 가치
- 거래 신호: $49 가치
- 총 가치: $136
- 당신의 가격: $50 (35% 절약)
포함됨: 전체 지표 색상
🎁 보너스: 무료 변동성 타이밍 가이드
구매 시 "다중 시간대 변동성 마스터리" - $39 가치 무료 제공.
포함 내용:
- 변동성 압축 거래 전략
- 다중 시간대 확인 기법
- 변동성 기간 위험 관리
- 실제 거래 사례
🚀 변동성 타이밍 마스터할 준비가 되셨나요?
"장바구니에 추가"를 클릭하고 시장 변동성을 보는 방식과 거래 방식을 혁신하세요.
"저는 모든 변동성 지표를 사용해봤습니다. 이 내장 신호가 있는 세 배 시간대 접근법이 제가 프로프 펌 거래에서 매일 사용하는 방법입니다."
- Sarah Rodriguez, 전문 스윙 트레이더
이 시장에 완벽합니다:
📊 주식 및 ETF
- SPY, QQQ 변동성 타이밍
- 변동성 기반 섹터 로테이션
- 실적 변동성 플레이
💹 외환 페어
- 주요 페어 변동성 분석
- 캐리 트레이드 위험 평가
- 돌파 확인
📈 원자재
- 금 변동성 주기
- 석유 변동성 급등
- 농산물 계절 변동성
🔄 암호화폐
- BTC/ETH 변동성 체제
- 알트코인 변동성 기회
- 암호화폐 위험 관리
결론: 이것은 단순한 표준편차 지표가 아닙니다. 시장이 움직이려 할 때를 정확히 보여주는 완전한 변동성 타이밍 시스템입니다.
한정 출시 제안: 최초 150개 한정 $89 (30달러 절약)
"아마추어와 전문가 거래의 차이는 종종 변동성 타이밍에 달려 있습니다. 이 지표가 그 격차를 좁혀줍니다."
지금 장바구니에 추가 → 전문가처럼 변동성을 거래하세요.
요약
Key features include:
- Triple timeframe visibility for immediate, swing, and position trading contexts.
- Volatility crossovers signaling regime shifts.
- Mean reversion and spike detection for volatility extremes.
- Customizable parameters to adapt to different CFD instruments and trading styles.
- Professional color-coded signals for quick interpretation.
This indicator suits various trading styles, including volatility breakout, mean reversion, risk-averse, and options trading. It supports multiple markets such as stocks, ETFs, forex pairs, commodities, and cryptocurrencies, providing volatility timing insights for assets like SPY, QQQ, gold, oil, BTC, and ETH.
Included with the indicator is a volatility timing guide covering compression strategies, multi-timeframe confirmation, risk management, and real trade examples. The tool requires tick data and outputs actionable signals to enhance volatility-based trading decisions.
고객 리뷰
5 | 50 % | |
4 | 50 % | |
3 | 0 % | |
2 | 0 % | |
1 | 0 % |


