
NEW ORDER FLOW MARKET DEPTH
Indicatore
4 acquisti
Versione 1.0, Mar 2026
Windows, Mac
4.0
Recensioni: 1
Descrizione
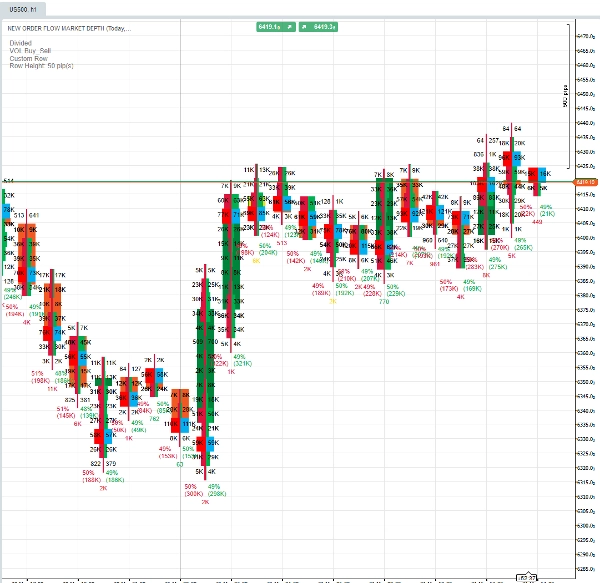
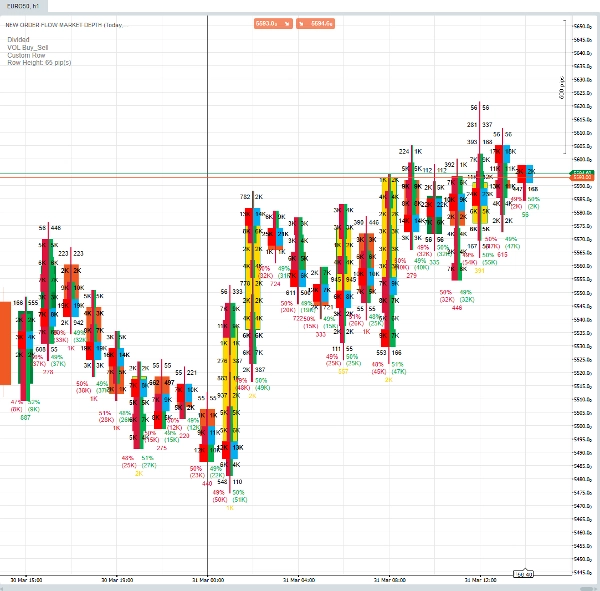
Order Flow Market Depth Pro porta i concetti di trading istituzionale sulla piattaforma retail cTrader. Analizzando i dati a livello di tick, questo indicatore rivela la pressione nascosta di acquisto e vendita all'interno di ogni candela. Che tu faccia trading su Forex, Indici o Commodities, comprendi il vero sentimento del mercato con grafici Footprint precisi e sovrapposizioni Depth of Market.
Caratteristiche principali
- 🔍 Modalità Volume Profile: Scegli tra Volume Normale, Suddivisione Acquisto/Vendita o Analisi Delta.
- 📊 Grafici Footprint: Visualizza il volume Bid vs. Ask a ogni livello di prezzo (modalità Divisa o Profilo).
- 📈 Analisi Delta: Monitora la pressione aggressiva di acquisto vs. vendita con il filtro Delta Cumulativo.
- 📉 Profondità di Mercato Live (DOM): Visualizza i libri di ordini limite live direttamente sul grafico (muri di liquidità Bid/Ask).
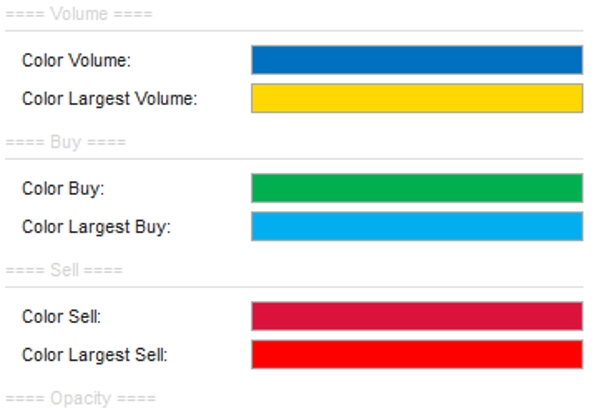
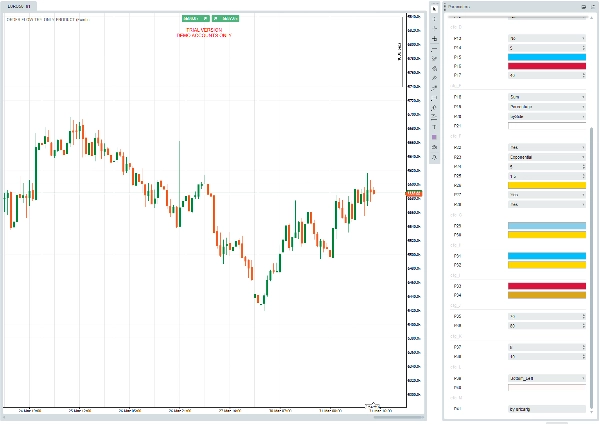
- 🎨 Visualizzazione Personalizzabile: Colori, opacità, altezze delle righe e dimensioni dei font completamente regolabili per adattarsi al tuo stile di trading.
- 🚀 Filtraggio Intelligente: Filtri Moving Average integrati per evidenziare picchi di volume significativi e ignorare il rumore.
- ⚡ Alte Prestazioni: Ottimizzato per grafici Renko, Range e Tick con gestione efficiente dei dati.
Dettagli della versione di prova
- Solo account demo: Questa versione di prova è completamente funzionale ma limitata agli account demo.
- Limite di 14 giorni: L'indicatore rimarrà attivo per 14 giorni dalla prima volta che lo alleghi a un grafico.
- Watermark visivo: Lo stato di prova è visualizzato sul grafico per garantire la conformità.
Come usare
- Allega l'indicatore al grafico desiderato.
- Seleziona la tua Modalità VOL (Normale, Acquisto/Vendita o Delta).
- Regola la Configurazione Righe su "Predefinita" per timeframe standard o "Personalizzata" per Renko/Range.
- Abilita Mostra DOM per vedere i livelli di liquidità live (richiede feed dati live).
- Usa il Filtro Risultati Grandi per evidenziare barre con attività di volume anomala.
Requisiti
- Piattaforma cTrader Desktop o Web.
- Accesso ai dati Tick (caricati automaticamente dall'indicatore).
- Account Demo (per la versione di prova).
Supporto e aggiornamenti
- Aggiornamenti regolari per la compatibilità con le nuove versioni di cTrader.
- Supporto dedicato per domande su installazione e configurazione.
Order Flow, Footprint, Market Depth, DOM, Volume Profile, Delta, Tick Volume, Renko, Range Bars, Institutional, Trial
Riepilogo
Riepilogo AI
Order Flow Market Depth Pro is an advanced indicator for the cTrader platform that applies institutional trading concepts to retail trading. It analyzes tick-level data to reveal hidden buying and selling pressure within each candle, supporting markets such as Forex, Indices, and Commodities. Key features include multiple volume profile modes (Normal Volume, Buy/Sell Split, Delta Analysis), Footprint charts that visualize bid versus ask volume at each price level, and cumulative Delta analysis to track aggressive buying and selling pressure. The indicator also displays live Market Depth (DOM) overlays showing real-time limit order books and liquidity walls directly on the chart. Users can customize visual elements like colors, opacity, row heights, and fonts to suit their trading style. Smart filtering with built-in Moving Average filters highlights significant volume spikes while reducing noise. It is optimized for Renko, Range, and Tick charts, ensuring high performance and efficient data handling. The trial version is fully functional on demo accounts for 14 days and includes a visual watermark. Requirements include the cTrader Desktop or Web platform and access to tick data, which the indicator loads automatically. Regular updates and dedicated support are provided for installation and configuration.
Profilo indicatore
Categoria indicatore
Flusso ordini/profondità mercato
Tipo di output
Visualizzazione
Requisiti per i dati
Solo barre
Dati sui tick
DoM
Volume
Segnali supportati
Intervallo di apertura della sessione
Divergenza
Recensioni dei clienti
4.0
Recensioni: 1
5 | 0 % | |
4 | 100 % | |
3 | 0 % | |
2 | 0 % | |
1 | 0 % |
Recensioni dei clienti
April 9, 2026
The better read comes from bad setups become easier to pass on. Volume context feels better when the tool stays in the background.
Discussioni
Domande frequenti
Signal
I prodotti disponibili tramite cTrader Store, inclusi bot di trading, indicatori e plugin, sono forniti da sviluppatori terzi e resi disponibili esclusivamente a scopo informativo e di accesso tecnico. cTrader Store non è un broker e non fornisce consulenze in materia di investimento, raccomandazioni individualizzate o garanzie di risultati futuri.
Altro da questo autore


![Logo di "[Hamster-Coder] Pivot Points MTF"](https://cdn.ctrader.com/image/webp/4c143e5a-309c-40e3-a578-f04d1e133ffa_31159)


Prezzo
49
Vendite
306
Installazioni gratuite