

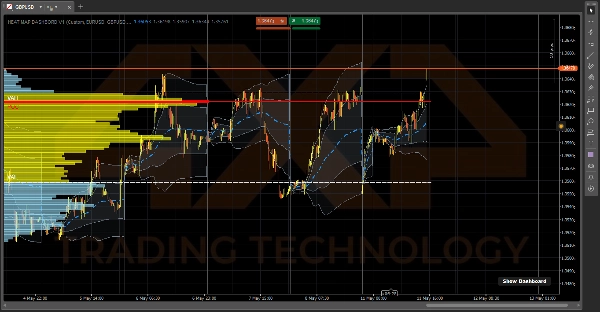

Descrizione
⚠️Aggiornamento goditi informazioni di vera profondità⚠️
🔥 DASHBOARD DELLA MAPPA DI CALORE 📈
Un terminale di flusso ordini e momentum di livello istituzionale per cTrader.
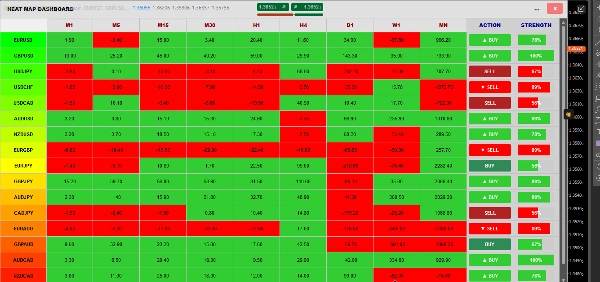
La Dashboard della Mappa di Calore non è solo una semplice sovrapposizione di grafici—è un ecosistema di trading in tre parti integrato direttamente nella tua piattaforma. Ti offre una visione "a raggi X" della liquidità di mercato, delle medie ponderate per volume reali e delle tendenze a livello macro, tutto senza rallentare il tuo computer. ⚡
🎯 Cosa Fa (La Vista del Trader)
Il sistema suddivide il tuo trading in tre semplici passaggi:
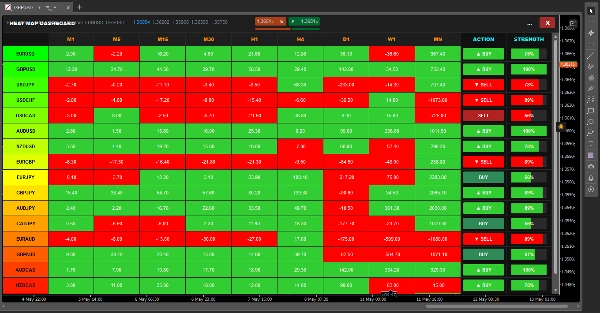
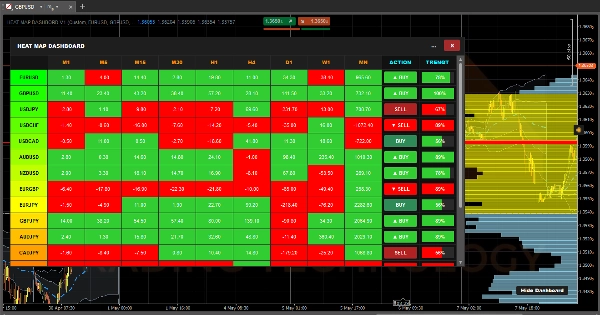
- 🎛️ Passo 1: COSA negoziare (La Matrice). Invece di cliccare tra dozzine di grafici, la dashboard scansiona 17 asset diversi su 9 timeframe (da M1 a Mensile). Calcola il momentum per ogni singola cella e la codifica a colori. A colpo d'occhio, sai esattamente quale coppia è in una tendenza massiccia e pronta per il trading.
- 🌊 Passo 2: CHI è al controllo (Il VWAP). Una volta scelta una coppia, guarda il VWAP Ancorato Giornaliero. Ti mostra il vero prezzo medio basato sul volume, non solo sulle candele. Le nuvole di Deviazione Standard ombreggiate agiscono come supporto/resistenza dinamici, mostrando esattamente quando il mercato è fortemente ipercomprato o ipervenduto.
- 📊 Passo 3: DOVE entrare (Il VRVP). Infine, il Profilo Volume dell’Intervallo Visibile mappa esattamente dove si trova la forte liquidità istituzionale. Disegna automaticamente il tuo Punto di Controllo (POC) e le linee del 70% Area di Valore (VAH & VAL), fornendoti livelli precisi per eseguire ingressi e uscite.
⚙️ Come Funziona (Dietro le Quinte)
La maggior parte degli indicatori che cercano di fare così tanti calcoli bloccheranno immediatamente la tua piattaforma e faranno crashare cTrader al 100% di utilizzo CPU. Per evitarlo, la Dashboard della Mappa di Calore è alimentata da tre motori indipendenti altamente ottimizzati che funzionano simultaneamente:
1. Il Motore della Dashboard (Il Battito Cardiaco di 2 Secondi) ⏱️ Se calcolassimo 153 combinazioni (17 coppie x 9 timeframe) ad ogni singolo tick di prezzo, il tuo computer si fonderebbe. Invece, questo motore funziona con un rigido timer a battito di 2 secondi. Ogni 2 secondi, osserva silenziosamente il prezzo di 14 candele fa, lo confronta con il prezzo attuale e colora la cella di Verde (momentum positivo) o Rosso (momentum negativo).
2. Il Motore VRVP (Il Lettore dello Schermo) 🖥️ Invece di caricare migliaia di barre di dati storici, il Profilo Volume agisce come un "Ascoltatore della Vista" dinamico. Si attiva solo quando effettui zoom o scroll fisicamente sul grafico. Chiede a cTrader quali candele sono attualmente visibili sullo schermo, calcola l’esatta sovrapposizione di volume per quelle barre specifiche e ridisegna istantaneamente l’Area di Valore al 70%.
3. Il Motore VWAP (L’Accumulatore di Tick) 🧮 Il VWAP è l’unica cosa che calcola sul tick live. Tuttavia, per mantenerlo fulmineo, utilizza una "Serie di Dati Cumulativi" leggera. Invece di ricalcolare tutto il giorno ogni secondo, aggiunge semplicemente il volume del nuovo tick a un totale in background in esecuzione, e si azzera automaticamente al millisecondo esatto in cui scatta la mezzanotte.
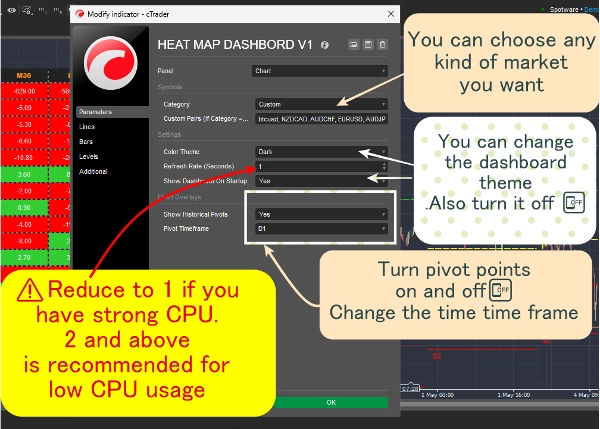
4. Il Gestore della Finestra (Il Mutante) 🪟 La dashboard è avvolta in una logica di dimensionamento C# personalizzata che ascolta attivamente il tuo monitor. Quando premi i pulsanti Massimizza [ ] o Ripristina [=], l’indicatore legge dinamicamente in tempo reale la tua Chart.Width e Chart.Height, adattandosi istantaneamente per adattarsi perfettamente allo schermo senza collassare!
Riepilogo
1. Market Momentum Matrix: Scans 17 assets across 9 timeframes (from 1 minute to monthly), calculating and color-coding momentum to identify trending pairs quickly.
2. Daily Anchored Volume Weighted Average Price (VWAP): Displays true average prices weighted by volume, with dynamic standard deviation clouds indicating overbought or oversold conditions.
3. Visible Range Volume Profile (VRVP): Maps institutional liquidity by highlighting the Point of Control (POC) and 70% Value Area (VAH & VAL) within the visible chart range, aiding precise entry and exit levels.
The dashboard operates via four optimized engines: a 2-second heartbeat engine for momentum updates, a viewport-driven VRVP engine for volume profile recalculations, a tick-accumulating VWAP engine for real-time volume-weighted pricing, and a dynamic window manager that adjusts the interface to fit the chart size. This architecture ensures efficient performance and real-time responsiveness. The indicator supports visualization, signals (including trend strength, breakouts, and reversals), and filtering based on tick data, volume, and market structure analysis. It is tagged for aggressive trading, market structure, liquidity sweeps, support/resistance, and risk dashboard functionalities.
Recensioni dei clienti
5 | 67 % | |
4 | 33 % | |
3 | 0 % | |
2 | 0 % | |
1 | 0 % |
Discussioni
Domande frequenti
Altro da questo autore


























Prezzo