present
Registrieren Sie sich und erhalten Sie $50 Rabatt auf Ihren ersten Kauf
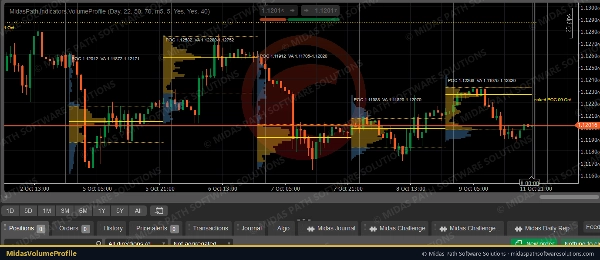
Trading product for MidasVolumeProfile Indikator Key Levels Volume, image 1
MidasVolumeProfile
Indikator
Version 1.3, Oct 2026
Windows, Mac
Trading product for MidasVolumeProfile Indikator Key Levels Volume, image 2
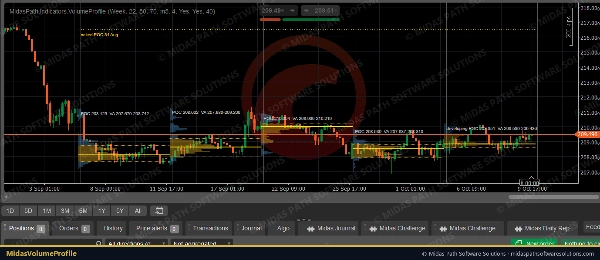
Trading product for MidasVolumeProfile Indikator Key Levels Volume, image 3
Trading product for MidasVolumeProfile Indikator Key Levels Volume, image 4
Seit 27/09/2026

Beschreibung

Midas Volume Profile shows where volume traded in each day or week, drawn as a histogram at the start of the session, with the levels profile traders use.


What it shows

• A volume histogram for each session, with the value area highlighted.

• POC (point of control): the price row with the most volume, drawn across the session.

• Value area high and low (VAH / VAL): the range around the POC that holds 70% of the session's volume (adjustable).

• Naked POCs: earlier sessions' POCs that price has not traded through since, extended to the right until price touches them.

• The developing profile of the current session, updated as each candle closes.


How it is built

• Volume is cTrader's tick volume (the number of price updates), the usual measure in forex and CFDs, where there is no central exchange volume. It is taken from a lower timeframe (5 minutes by default) for detail.

• Each candle's volume is shared across the price rows its high-low range covers, in proportion to the overlap. The session's range is split into 50 rows (adjustable).

• The value area grows from the POC towards whichever neighbouring row holds more volume, until it holds the chosen share.


Settings

• Profiles per day or per week, session start hour (22:00 UTC by default, the forex day), rows, value-area share, volume timeframe.

• Number of sessions shown, developing session on or off, naked POCs on or off, histogram width and colours.


Tested

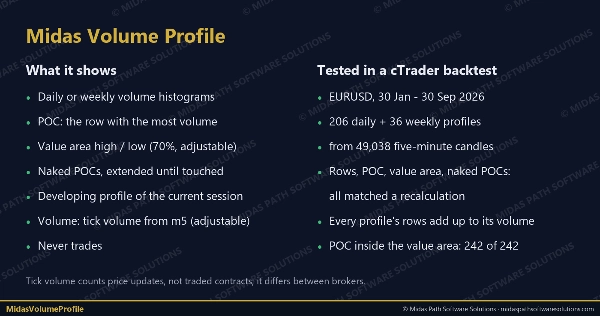
• In a cTrader backtest on EURUSD (30 Jan-30 Sep 2026), all 206 daily and 36 weekly profiles built from 49,038 five-minute candles matched an independent recalculation: session boundaries, every row's volume (each profile's rows add up to its total volume), POC, value area and every naked-POC touch.

• On that data the POC sat inside the value area in every profile, the value area held 71% of volume on average (rows are whole, so it slightly exceeds 70%), and 10 daily and 2 weekly POCs were still naked at the end.


Notes

• Tick volume counts price changes, not traded contracts; it differs between brokers.

• Volume profiles describe where trading happened; they do not predict where price will go.

• It never trades and needs no internet or file access.

Zusammenfassung

KI-Zusammenfassung
Midas Volume Profile is an indicator that visualizes session volume distribution using tick volume data, primarily for forex and CFD markets where centralized volume is unavailable. It displays a histogram of traded volume for each day or week at the session start, highlighting key levels used by volume profile traders.

Key features include:
- Point of Control (POC): the price level with the highest traded volume, extended across the session.
- Value Area High and Low (VAH/VAL): price range around the POC containing approximately 70% of the session’s volume, adjustable by the user.
- Naked POCs: POCs from previous sessions that price has not revisited, extended until touched.
- A developing profile for the current session, updated with each candle close.

The indicator calculates volume by distributing each candle’s tick volume proportionally across price rows within its high-low range, dividing the session range into adjustable rows (default 50). It supports profiles per day or week, customizable session start times, and visual settings such as histogram width and colors.

Midas Volume Profile operates without trading or internet access and has been tested for accuracy against independent recalculations on EURUSD data. It provides a detailed view of where trading activity concentrates but does not predict price direction.
Indikatorprofil
Indikatorkategorie
Volumen
Ausgabetyp
Visualisierung
Datenanforderungen
Nur Balken

Diskussion

Kundenbewertungen

0.0
Bewertungen: 0
Kundenbewertungen
Bisher gibt es keine Bewertungen für dieses Produkt. Haben Sie es schon ausprobiert? Dann können Sie die erste Person sein, die andere darüber informiert!

Häufig gestellte Fragen (FAQ)

Key Levels
Volume
Support & Resistance
Über den cTrader Store verfügbare Produkte, einschließlich Handelsbots, Indikatoren und Plugins, werden von externen Entwicklern bereitgestellt und nur zu Informations- und technischen Zugriffszwecken verfügbar gemacht. cTrader Store ist kein Broker und erbringt keine Anlageberatung, persönlichen Empfehlungen oder eine Garantie für zukünftige Performance.

Mehr von diesem Autor
Desktop-Plugin
File Access
Trade Journal
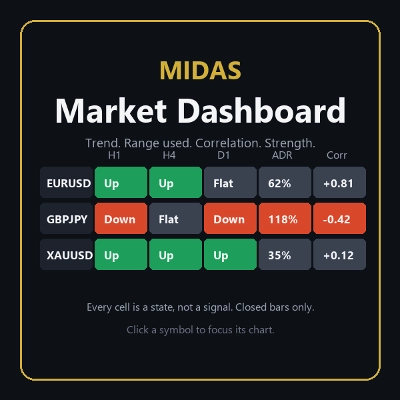
Your watchlist in one grid: trend on five timeframes, ADR used, correlation to the chart's symbol, currency strength.
Indikator
Key Levels
Liquidity Grab
+2
The levels you mark each morning, drawn and followed: PDH/PDL, weekly, monthly, sessions, equal highs/lows.
cBot
Partial Close
Prop Firm Fit
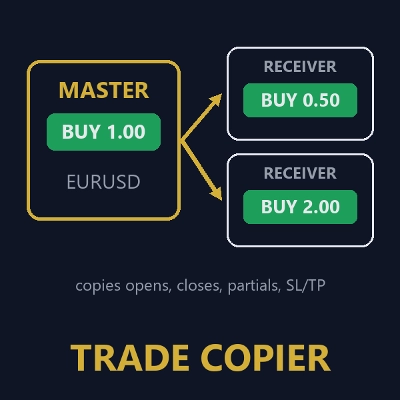
Copies opens, closes, partial closes and SL/TP from one cTrader account to others on the same PC, with safe sizing.
Desktop-Plugin
External Data
Study economic event reactions with broker M1 history, bar replay, range comparisons and a reproducible export.

Das könnte Sie auch noch interessieren

Indikator
ATR
BOS
+5
Opening ranges, dynamic trend channels, and multi-scale breakout/retest analysis for clear intraday chart decisions.
Indikator
ADX
ATR
+5
Configure, simulate, and analyze trading strategies with custom filters, multi-target exits, and detailed performance me
Indikator
AI
ATR
+19
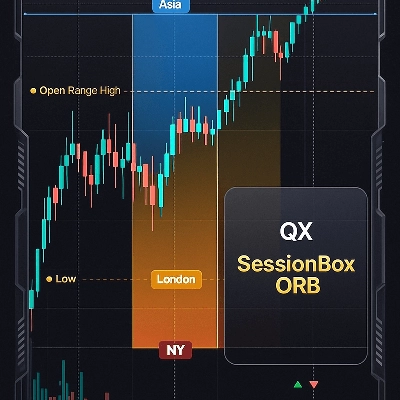
QX SessionBox ORB: Session boxes + ORB levels + clean dashboard with optional closed-candle breakout signals.
Indikator
SMC
Prop
+13
Tracks virgin levels. Lines vanish only after a candle closes beyond the high/low on your chosen timeframe.
Indikator
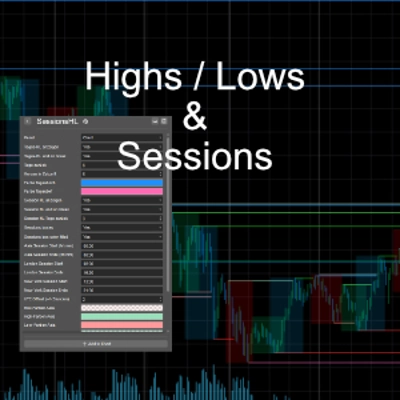
Shows daily and sessions highs / lows and session boxes, everything configurable
„ZigXRay“-Logo
Beste Ratings
4.6
(5)
$29
/
$49
Indikator
CHOCH
Key Levels
+5
ZigZag Market Structure Identifier - Multi-Layer Scanner: Convergent Pivot Detection, 4-TF Overlay & Naked Chart Mode.
Indikator
ATR
Forex
+5
Most used candle patterns. (1 candle, 2 candles and 3 candles patterns) and Marubozu. Bonus Fibo Risk control.
Indikator
AI
Grid
+17
BORIS Easy Trend: Relax & scalp with 6-TF alignment. Clear BUY/SELL signals & movable UI/HUD make trading effortless.
Indikator
Key Levels
Liquidity Grab
+2
The levels you mark each morning, drawn and followed: PDH/PDL, weekly, monthly, sessions, equal highs/lows.
Indikator
Forex
Identify 34 candlestick patterns, track trends across timeframes, and get instant alerts with this powerful trading tool
Indikator
AI
ATR
+19
Market Cipher A
Indikator
Prop
Forex
+10
IBS Indicator – Measures price position within bars for smarter trades. Works on all markets & timeframes.
Indikator
Prop
Forex
+4
Pivot Points Standard — All-in-One Multi-Timeframe Pivot Indicator for cTrader
Indikator
Doji
Volume
+5
Instantly spot high-liquidity institutional moves with clean, non-obtrusive triangle alerts on cTrader charts.
Indikator
AI
ATR
+9
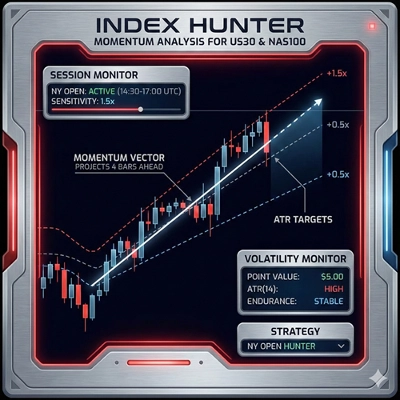
Index Hunter: Momentum analysis for US30 & NAS100. Designed to identify high-velocity moves and intraday trends.
Indikator
ATR
Prop
+13
Enhance trading with ATR Bands! Visualize market volatility using dynamic upper and lower ATR bands for precise decision
Indikator
BOS
EMA
+5
VWAP Bands indicator with 3 standard deviation levels, buy/sell zones, and a draggable ON/OFF button to toggle the entir
Indikator
Prop
Forex
+4
Universal multi time frame 'Moving Average' indicator with extended features

Preis

Seit 27/09/2026