

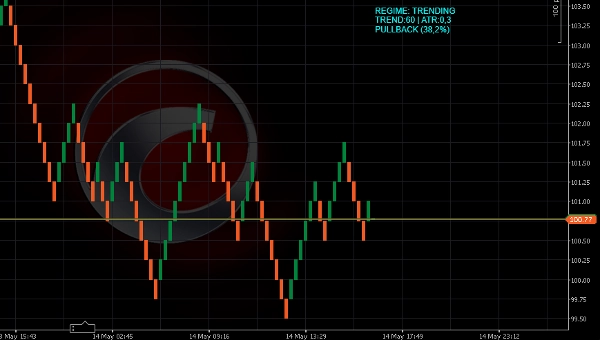
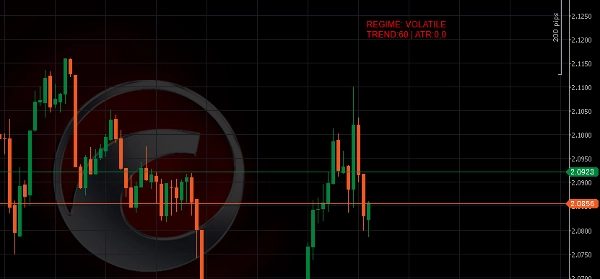
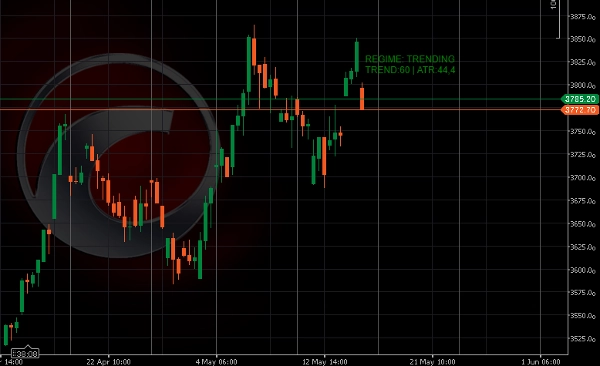

คำอธิบาย
# ตัวตรวจจับสภาวะตลาด
**★★★★★ 4.7 จาก 5 (4 รีวิว)
> *"สะอาด น้ำหนักเบา และช่วยจริงๆ ในการปรับกลยุทธ์ให้เข้ากับสภาวะตลาดที่เปลี่ยนแปลง."* – **algo.expert** ★★★★★
> *"ตัวบ่งชี้บริบทตลาดที่ใช้งานได้จริงซึ่งจัดประเภทสภาวะเป็น Trending, Ranging, Volatile และ Pullback. ตัวกรองความคงทนช่วยลดการสลับสภาวะที่มีเสียงรบกวน."* – **algo.expert** ★★★★★
ตัวตรวจจับสภาวะตลาดเป็นตัวบ่งชี้มืออาชีพที่บอกคุณอย่างชัดเจนว่าคุณอยู่ในตลาดประเภทใด: TRENDING, RANGING หรือ VOLATILE.
หยุดเดาเลยว่าตลาดกำลังเคลื่อนไหวหรือไม่ - ให้ตัวบ่งชี้ทำงานแทนคุณ
## 🔹 สิ่งที่ทำให้มันโดดเด่น
ไม่เหมือนตัวบ่งชี้สภาวะอื่นๆ ที่แสดงแค่ทิศทางแนวโน้มพื้นฐาน ตัวตรวจจับสภาวะตลาดมี:
✅ **ตัวกรองต้านเสียงรบกวน** – ไม่สนใจการเคลื่อนไหวของราคาที่น้อยมาก เหมาะสำหรับตลาดที่เงียบซึ่งอาจให้สัญญาณแนวโน้มผิดพลาด
✅ **การตรวจจับการดึงกลับ** – ระบุการถอยกลับภายในแนวโน้มโดยใช้เกณฑ์เปอร์เซ็นต์ตาม ATR (ระดับฟีโบนักชี: 23.6%, 38.2%, 61.8%, 78.6%) คุณตั้งเกณฑ์ที่ตรงกับสไตล์การเทรดของคุณ
✅ **ตัวกรองความคงทน** – ป้องกันการเปลี่ยนสภาวะบ่อยครั้งด้วยแท่งยืนยันที่ตั้งค่าได้ ไม่มีการกระพริบระหว่างสภาวะอีกต่อไป
✅ **ใช้งานได้กับกราฟทุกประเภท** – Renko, Candlestick, Tick, Range, Volume, Point & Figure, Kagi. ใช้งานได้จริงทั่วถึง
## 🔹 การจำแนกสภาวะ
| สภาวะ | สี | กลยุทธ์ |
|--------|-------|----------|
| **TRENDING** | เขียว | ตลาดมีทิศทาง เหมาะสำหรับการตามแนวโน้ม |
| **RANGING** | สีทอง | ตลาดเคลื่อนไหวไซด์เวย์ ควรหลีกเลี่ยงหรือใช้การกลับสู่ค่าเฉลี่ย |
| **VOLATILE** | แดง | ความผันผวนสูง เหมาะสำหรับการเทรดเบรกเอาท์ |
## 🔹 วิธีการทำงานของการตรวจจับการดึงกลับ
เมื่อราคาถอยกลับเกินเกณฑ์ที่คุณเลือก (เช่น 38.2% ของ ATR) ตัวบ่งชี้จะแสดงข้อความ `PULLBACK (38.2%)` และเปลี่ยนสีเป็นสีฟ้า ซึ่งบอกว่าราคาถอยกลับอย่างมีนัยสำคัญและอาจเป็นจุดเข้าที่ดีในทิศทางของแนวโน้มหลัก
## 🔹 ปรับแต่งได้อย่างเต็มที่
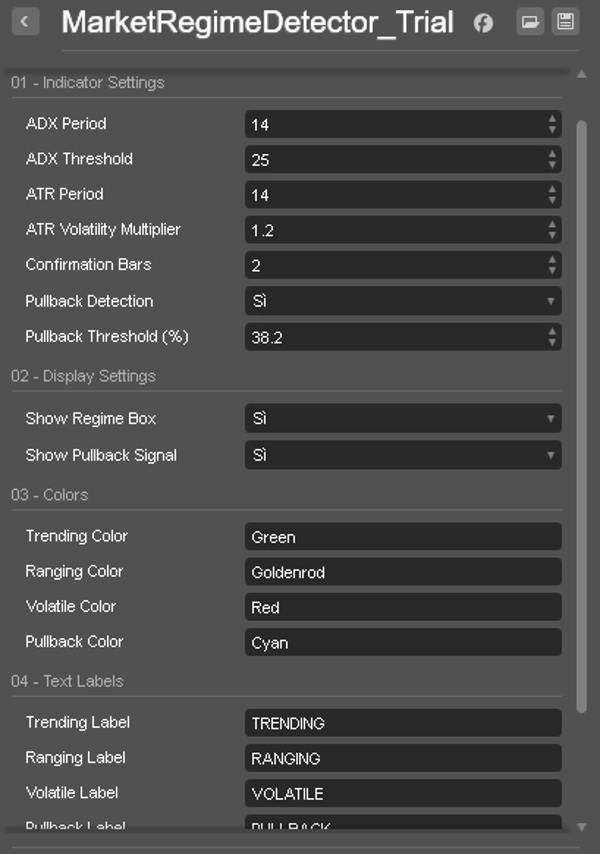
• ปรับช่วงเวลาและเกณฑ์ ADX
• ปรับช่วงเวลา ATR และตัวคูณความผันผวน
• ตั้งค่าแท่งยืนยันสำหรับการเปลี่ยนสภาวะ
• เลือกเกณฑ์การดึงกลับ (23.6% ถึง 78.6%)
• ปรับแต่งสีและป้ายข้อความทั้งหมด
• วางข้อความได้ทุกที่บนกราฟ
## 🔹 ทำไมคุณถึงต้องการมัน
• รู้เวลาที่แน่นอนในการเทรดและเวลาที่ควรหลีกเลี่ยง
• หลีกเลี่ยงสัญญาณผิดพลาดในตลาดไซด์เวย์หรือเงียบ
• ระบุการดึงกลับเพื่อจังหวะเข้าที่ดีกว่า
• ปรับกลยุทธ์ให้เข้ากับความผันผวนปัจจุบัน
• ใช้งานได้กับทุกกรอบเวลาและเครื่องมือ
## 🔹 ความคิดเห็นจากเทรดเดอร์
> *"สะอาด น้ำหนักเบา และช่วยจริงๆ ในการปรับกลยุทธ์ให้เข้ากับสภาวะตลาดที่เปลี่ยนแปลง."* – **algo.expert** ★★★★★
> *"ตัวกรองความคงทนช่วยลดการสลับสภาวะที่มีเสียงรบกวน ในขณะที่การตรวจจับการดึงกลับเพิ่มบริบทการต่อเนื่องของแนวโน้มที่มีประโยชน์."* – **algo.expert** ★★★★★
> *"เครื่องมือที่ยอดเยี่ยมสำหรับการกรองสภาวะตลาด."* – **ForexQuantGuru** ★★★★★
> *"ใช้งานได้จริงและน้ำหนักเบา."* – **ScalperBot9000** ★★★★★
## 🔹 ราคาและการทดลองใช้
• **ราคาปกติ: $20 USD**
• **ทดลองใช้ฟรีเต็มฟังก์ชัน 7 วัน** (ไม่มีการจำกัดฟีเจอร์)
• ชำระเงินครั้งเดียว ใช้ได้ตลอดชีพ
⚠️ **ข้อจำกัดความรับผิดชอบ**: การเทรดมีความเสี่ยงที่จะขาดทุน ตัวบ่งชี้นี้เป็นเครื่องมือวิเคราะห์ตลาด ไม่ใช่เครื่องมือสร้างสัญญาณเทรด ผลงานในอดีตไม่รับประกันผลลัพธ์ในอนาคต โปรดใช้การบริหารความเสี่ยงอย่างเหมาะสมเสมอ
📌 **มีคำถามหรือขอฟีเจอร์เพิ่มเติม?** ติดต่อฉันผ่าน cTrader Store
**ขอให้เทรดอย่างมีความสุข! – CapitalMente**
สรุป
This tool works on any chart type, including Renko, Candlestick, Tick, Range, Volume, Point & Figure, and Kagi charts, and is applicable across all timeframes and instruments. It provides clear visual cues with color-coded regimes: green for trending markets, goldenrod for ranging, red for volatile, and cyan for pullbacks. The indicator allows full customization of ADX and ATR parameters, confirmation bar settings, colors, text labels, and text positioning on the chart.
Market Regime Detector aids traders in adapting strategies to current market conditions by indicating when to trade or avoid the market, improving entry timing through pullback identification, and filtering out noise in quiet markets.
รีวิวจากลูกค้า
5 | 60 % | |
4 | 40 % | |
3 | 0 % | |
2 | 0 % | |
1 | 0 % |

















!["[Stellar Strategies] MARSI Signal Plotter" โลโก้](https://cdn.ctrader.com/image/webp/7b2b8da6-8f8e-4646-8d4a-4710c516c01e_25567)


