
Beschreibung
Dieser technische Analyseindikator liefert Informationen über die Marktstimmung, den Trend und die Preisniveaus. Er verwendet Daten wie Volumen, Open_Close, Chaikin Volatility und Chaikin Money Flow, um die Marktstimmung zu berechnen. Außerdem ermöglicht er die Anpassung von Spreads, die Erkennung von Trends und die Visualisierung von Preisniveaus und Pips. Er ist ein nützliches Werkzeug, um die vorherrschende Kraft auf dem Markt zu identifizieren, Preisbewegungen vorherzusehen und die Handelsentscheidungen zu verbessern.
In der Beschreibung gebe ich die wichtigen Parameter an; der Rest sind Stilkonfigurationen wie Farbe, Linientyp und Schriftgröße.
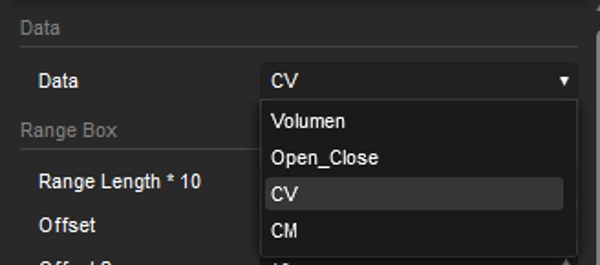
Daten
Die Stimmungsberechnungen basieren auf der Auswahl von Volumen, Open_Close, Chaikin Volatility und Chaikin Money Flow.
Range Länge * 10
Der Wert gibt die Anzahl der Kerzen (Perioden) an, auf denen die Berechnung basiert – der Wert wird mit 10 multipliziert.
Zoom hinzufügen
Um das Diagramm zentriert zu halten, hilft dies auch, Situationen wie Konsolidierung und Trendwechsel zu berücksichtigen.
Rand
Ermöglicht die Anpassung der oberen und unteren Ränder zur Verbesserung der Visualisierung.
Stimmung anzeigen
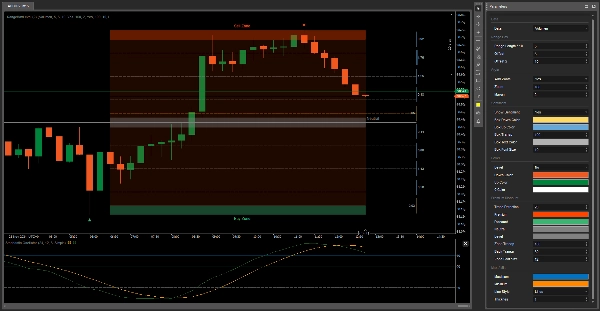
Die Stimmung zeigt an, welche Kraft momentan auf dem Markt stärker ist. Wenn die gelben Balken größer werden, bedeutet das, dass es mehr Verkäufer gibt, und umgekehrt. Wenn Sie die Stimmungsvisualisierung nicht sehen möchten, können Sie sie auf der rechten Seite ausblenden.
Level
Dies ist eine zusätzliche Funktion, die als Referenz für Preise und Pips auf jedem Level verwendet werden kann. Wenn Sie ein Level auswählen, an dem Sie die Kauforder platzieren möchten, zeigt es die Pips auf jedem Level an, die der Preis erreichen kann.
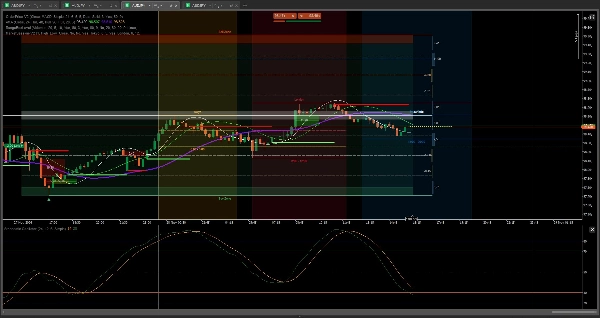
Trenderkennung
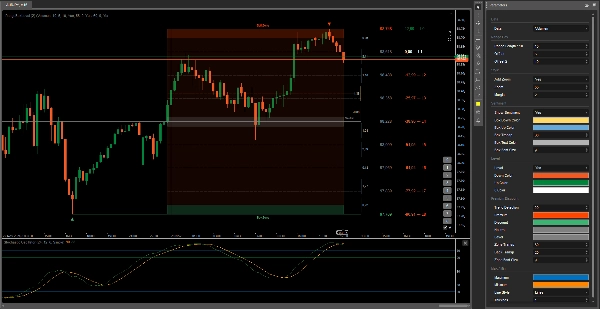
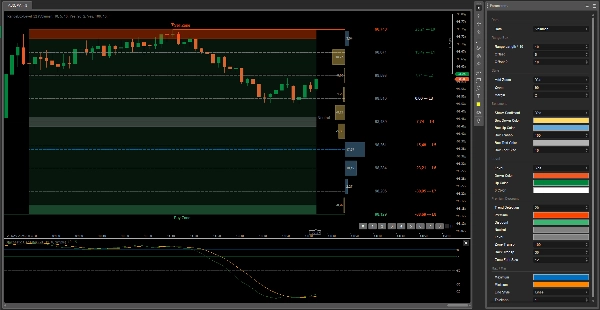
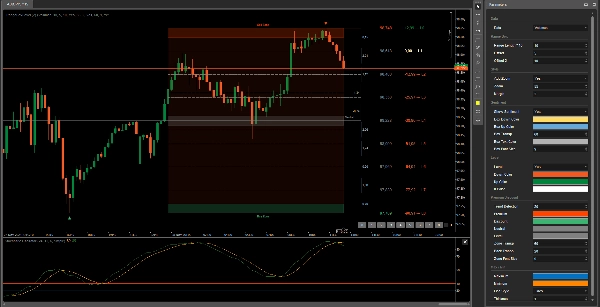
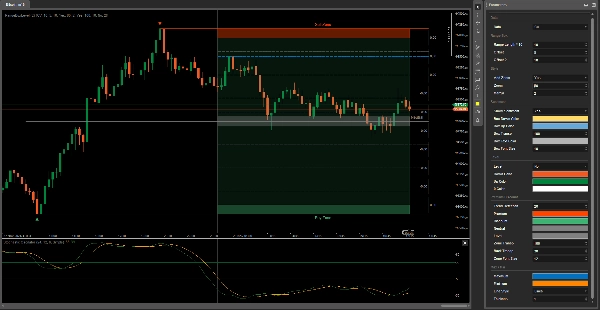
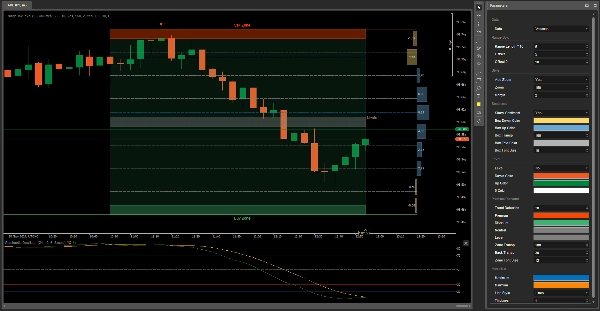
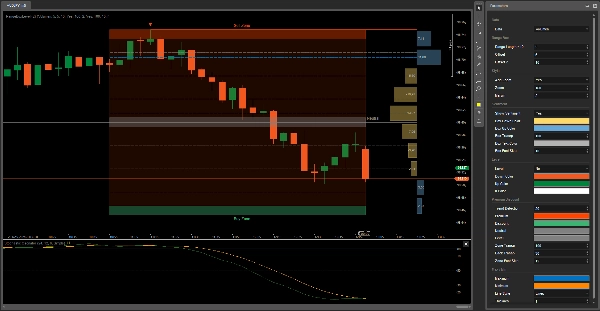
Je nach Trend des Assets ändert sich der Hintergrund des Range-Box: grün, wenn es bullisch ist, und rot, wenn es bärisch ist.
Max / Min
Dies sind die blauen und gelben Linien, die ihre Position entsprechend der Vorhersage ändern, wohin der Preis gehen könnte. Die Range-Box ist in 9 Abschnitte unterteilt, um die Preiswendepunkte zu bestimmen und dient als Fibonacci-Retracement.
Du wirst unbesiegbar sein
Viel Glück 😀
Zusammenfassung
Key features include sentiment visualization with bars indicating the dominance of buyers or sellers, trend detection through background color changes (green for bullish, red for bearish), and level indicators that display potential price and pip targets for placing orders. The Range Box is divided into nine sections to identify price inflection points, functioning similarly to Fibonacci retracement levels, with dynamic max/min lines predicting possible price movements.
This tool supports analysis across various markets including stocks, cryptocurrencies, indices like NAS100, and commodities such as XAUUSD (gold). It is suitable for trading strategies like scalping and grid trading and can assist traders in anticipating price movements and making informed decisions. The indicator integrates with additional tools for enhanced order price management and market session analysis.
Kundenbewertungen
5 | 100 % | |
4 | 0 % | |
3 | 0 % | |
2 | 0 % | |
1 | 0 % |


