
Penerangan
🔍 Memeriksa data volum sepanjang tempoh sejarah tertentu, menyoroti kawasan berpotensi di mana pelabur yang sangat leverage mungkin menghadapi likuidasi, memberikan pandangan berharga tentang tingkah laku pasaran.
Apa yang dilakukan oleh penunjuk ini?
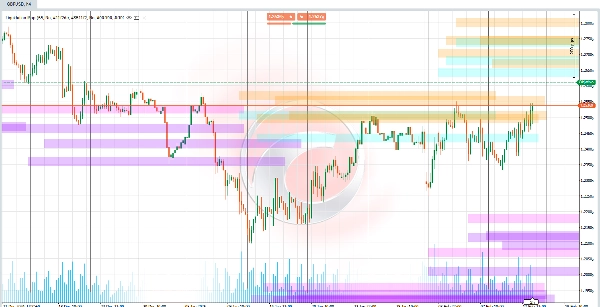
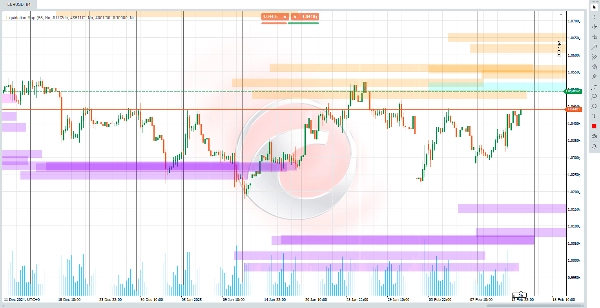
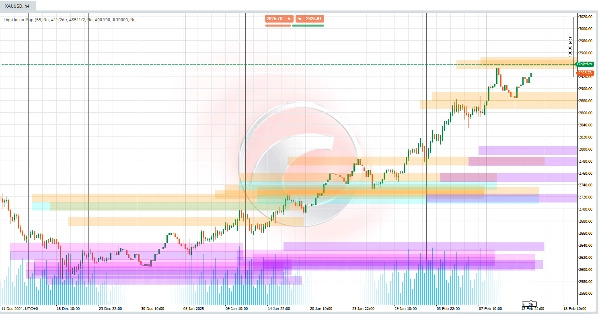
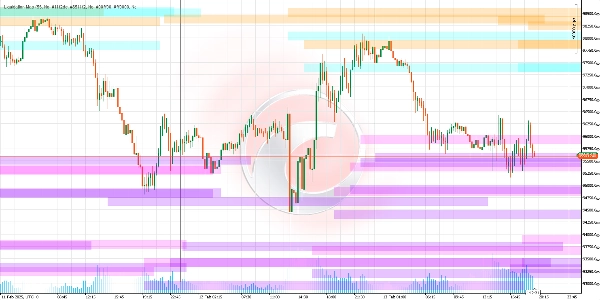
Algoritma ini mengenal pasti tahap harga di mana likuidasi besar-besaran posisi leverage (seperti 5x, 10x, 25x, 50x, atau 100x) mungkin berlaku. Tahap ini bertindak sebagai "magnet" untuk pergerakan harga, kerana likuidasi boleh mencetuskan ayunan pasaran yang tajam. Penunjuk ini melukis garis mendatar pada carta, mewakili ambang ini dan meramalkan mereka ke masa depan untuk menjangkakan zon utama yang menarik.
Bagaimana tahap ini dikira?
- Pengesanan Pivot Harga:
🔄 Ia mengenal pasti paras tertinggi dan terendah terkini dalam carta (titik di mana harga berubah arah). Pivot ini adalah asas untuk mengira tahap likuidasi. - Volum sebagai Pencetus:
📊 Membandingkan volum semasa dengan purata sejarah. Jika volum melebihi ambang tertentu (contohnya, 1.2x purata untuk 100x), ia mengaktifkan tahap likuidasi yang sepadan. - Formula Likuidasi:
Semakin tinggi leverage, semakin dekat tahap likuidasi dengan harga semasa. -
- Untuk posisi panjang: Tahap likuidasi ditetapkan di bawah pivot rendah, dikira berdasarkan leverage (contohnya, 2% di bawah untuk 50x).
- Untuk posisi pendek: Tahap ditetapkan di atas pivot tinggi, menggunakan prinsip yang sama.
Apa yang boleh anda jangkakan apabila menggunakannya?
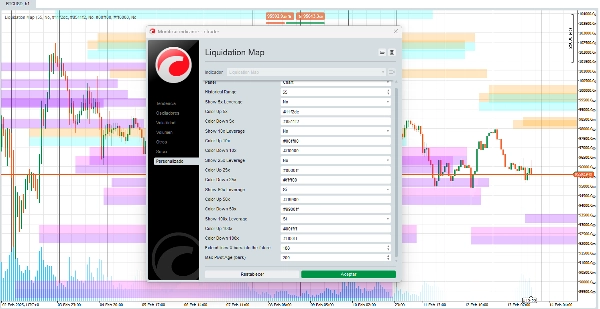
- Garis Likuiditi: 🎨 Anda akan melihat garis mendatar yang boleh disesuaikan mewakili zon di mana pasaran mungkin mengalami volatiliti tinggi disebabkan likuidasi.
- Leverage Boleh Dikonfigurasi: ⚙️ Anda boleh mengaktifkan/mematikan tahap untuk setiap jenis leverage (contohnya, fokus hanya pada 50x dan 100x).
- Penyesuaian Warna: 🌈 Anda boleh memilih warna untuk setiap julat likuidasi, menyesuaikan visualisasi mengikut keutamaan anda.
- Zon Kesesakan: 🎯 Beberapa garis yang berhampiran menunjukkan kawasan risiko tinggi/ganjaran tinggi di mana beberapa likuidasi boleh berlaku serentak.
Bagaimana untuk mentafsir isyarat?
- Harga Mendekati Garis: 🚨 Jika harga hampir dengan tahap likuidasi (terutamanya dengan volum tinggi), kebarangkalian pergerakan tajam meningkat.
- Warna dan Ketelusan: 🎨 Warna berbeza mengikut leverage (contohnya, biru untuk 25x, jingga untuk 50x). Ketelusan menunjukkan "kekuatan" volum yang berkaitan (garis lebih gelap = volum lebih signifikan).
Mengapa ia berguna?
- Ramalan Proaktif: 🔮 Ia bukan sahaja menganalisis masa lalu; ia meramalkan tahap masa depan berdasarkan keadaan semasa.
- Fokus Psikologi Pasaran: 🧠 Likuidasi paksa sering mencipta reaksi berantai (contohnya, pesanan stop-loss mencetuskan lebih banyak jualan). Penunjuk ini membantu anda menjangkakannya.
- Penyesuaian: 🛠️ Sesuaikan visualisasi mengikut strategi anda (contohnya, utamakan leverage lebih tinggi dalam pasaran yang tidak stabil).
Had yang perlu dipertimbangkan
- Kebergantungan Volum: 📉 Jika volum rendah atau data sejarah tidak mencukupi, isyarat mungkin kurang boleh dipercayai.
- Bukan Bola Kristal: 🔮 Tahap menunjukkan zon yang mungkin, bukan kepastian. Sentiasa gabungkan dengan analisis lain.
- Persekitaran Dinamik: 🌍 Dalam pasaran dengan berita tidak dijangka, likuidasi boleh berlaku di luar tahap yang diramalkan.
Penunjuk Kedai Ctrader:
Struktur Pasaran Dinamik
Analisis Titik Pusing
Fibonacci Linear
Regresi Multi-masa
Bias Lilin Berbilang Tahap
Penjejak
Garis Trend Sokongan dan
Rintangan Auto
Ringkasan
Ulasan pelanggan
5 | 67 % | |
4 | 0 % | |
3 | 33 % | |
2 | 0 % | |
1 | 0 % |


![Logo "[Stellar Strategies] Smart ADX"](https://cdn.ctrader.com/image/webp/af13b084-b6f6-41db-b7bc-c7e688b57b05_36929)


