
Penerangan
Penunjuk Penilaian Kualitatif Kuantitatif (QQE) Multi-Jangka Masa
Penunjuk Penilaian Kualitatif Kuantitatif (QQE) adalah alat analisis teknikal yang meningkatkan Indeks Kekuatan Relatif (RSI) dengan menggabungkan purata bergerak yang dilicinkan. Ia membantu pedagang menilai kekuatan tren, potensi pembalikan, dan keadaan terlebih beli/terlebih jual dengan ketepatan yang lebih tinggi.
QQE mempunyai dua komponen utama: tahap hentian trailing pantas dan perlahan, yang berfungsi sebagai sokongan dan rintangan dinamik. Ini menjadikannya alat serbaguna untuk kedua-dua strategi mengikuti tren dan pembalikan purata. Persilangan antara garis QQE dan garis isyaratnya sering menunjukkan potensi peluang beli atau jual.
QQE Multi-Jangka Masa: Versi Lanjutan
Versi lanjutan penunjuk QQE ini direka sebagai alat multi-jangka masa, menggabungkan kedua-dua garis tren pantas dan perlahan untuk ketepatan yang lebih baik. Dengan menganalisis tindakan harga merentasi pelbagai jangka masa, ia memberikan pandangan menyeluruh tentang tren pasaran.
Algoritma pelicinan lanjutannya meningkatkan kebolehpercayaannya, menjadikannya penunjuk berdiri sendiri yang berkesan untuk:
✅ Mengenal pasti arah tren
✅ Menjana isyarat masuk dan keluar yang tepat
✅ Mengesan keadaan terlebih beli dan terlebih jual
Fleksibiliti QQE Multi-Jangka Masa menjadikannya sesuai untuk kedua-dua strategi mengikuti tren dan pembalikan.
Cara Menggunakan QQE Multi-Jangka Masa
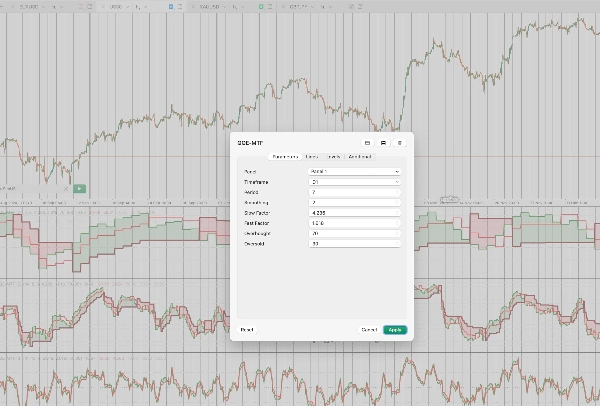
Untuk mengkonfigurasi QQE Multi-Jangka Masa, pedagang mesti memilih:
🔹 Satu jangka masa (contohnya, Harian, H4, H1)
🔹 Tempoh (bilangan lilin yang digunakan dalam pengiraan)
🔹 Tempoh pelicinan (untuk pelicinan RSI)
🔹 Faktor perlahan dan pantas (untuk melaraskan kepekaan)
🔹 Tahap terlebih beli dan terlebih jual yang boleh disesuaikan
📌 Nota: Oleh kerana ini adalah penunjuk multi-jangka masa, selepas menambahnya ke carta, adalah penting untuk mengecilkan dalam antara muka cTrader untuk membenarkan data yang mencukupi dimuat dan penunjuk diinisialisasi dengan betul.
Strategi Perdagangan dengan QQE Multi-Jangka Masa
1️⃣ QQE untuk Pengesahan Tren Jangka Masa Tinggi
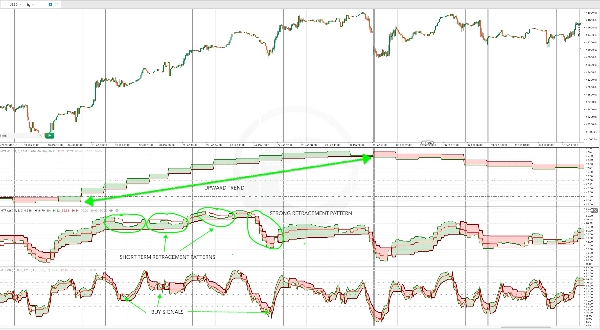
Satu cara berkesan menggunakan QQE Multi-Jangka Masa adalah untuk pengesahan tren pada jangka masa yang lebih tinggi sambil mengenal pasti kemasukan retracement pada jangka masa yang lebih rendah.
Sebagai contoh:
- Penunjuk QQE pada jangka masa harian digunakan untuk mengesahkan tren yang kuat.
- Kemasukan retracement kemudian dikenalpasti apabila Stochastic Oscillator melintasi tahap terlebih beli atau terlebih jual.
Kaedah ini membantu pedagang menyelaraskan kemasukan mereka dengan tren keseluruhan.
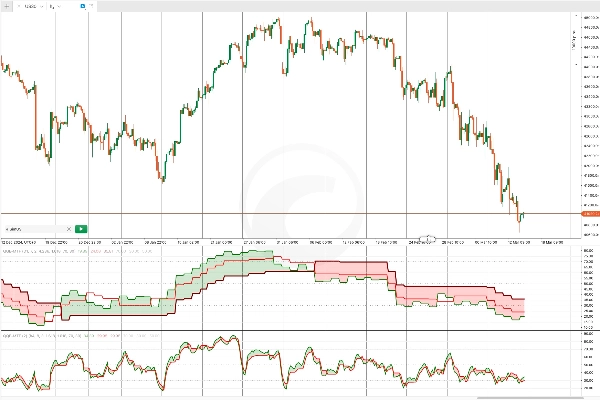
2️⃣ Analisis Multi-Jangka Masa untuk Pemahaman Pasaran yang Lebih Mendalam
Menggunakan QQE merentasi pelbagai jangka masa membolehkan pedagang memperoleh pemahaman yang lebih terperinci tentang tingkah laku aset.
Sebagai contoh, dengan menggunakan QQE pada:
📊 Jangka masa harian (D1): Menentukan arah tren keseluruhan.
📊 Jangka masa 4 jam (H4): Mengesahkan arah tren dan mengenal pasti pullback jangka pendek.
📊 Jangka masa 1 jam (H1): Menjana isyarat masuk yang tepat berdasarkan keadaan terlebih beli/terlebih jual atau pergerakan bertentangan tren.
Pendekatan berstruktur ini meningkatkan penentuan masa perdagangan dan pembuatan keputusan dengan menyelaraskan isyarat merentasi jangka masa yang berbeza.
Ringkasan
This advanced multi-timeframe tool integrates fast and slow trend lines to analyze price action across different timeframes, providing a comprehensive view of market trends. Its smoothing algorithm improves reliability, making it effective for identifying trend direction, generating precise entry and exit signals, and detecting overbought/oversold levels.
Users configure the indicator by selecting a timeframe (e.g., Daily, H4, H1), periods for calculation, smoothing period for RSI, sensitivity factors, and customizable overbought/oversold thresholds. It is recommended to zoom out in the cTrader interface after adding the indicator to allow sufficient data loading.
Typical strategies include using the QQE on higher timeframes for trend confirmation and on lower timeframes for entry timing, as well as multi-timeframe analysis to enhance trade timing and decision-making by aligning signals across timeframes.
Ulasan pelanggan
5 | 50 % | |
4 | 50 % | |
3 | 0 % | |
2 | 0 % | |
1 | 0 % |


