
HA
Indikator
2 käufe
Version 1.0, Jan 2026
Windows, Mac
4.0
Bewertungen: 1
Beschreibung
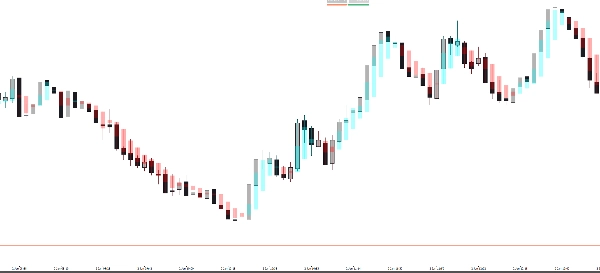
Das Pro Heikin Ashi Visual Overlay ist das perfekte Werkzeug für Trader, die die Trend-Glättungsvorteile von Heikin Ashi Kerzen nutzen möchten, während sie ihre Standard-Kerzen- oder Balkendiagramme aktiv halten.
Traditionelle Heikin Ashi Charts erfordern, dass Sie den gesamten Charttyp wechseln, was es schwierig macht, die genaue Kursbewegung zu sehen. Dieser Indikator löst das, indem er Heikin Ashi Kerzen als halbtransparentes Overlay zeichnet, sodass Sie Trendwenden und Marktmomentum sofort erkennen können, ohne den Blick auf den realen Kurs zu verlieren.
Warum dieses Overlay verwenden?
- 💎 Rauschunterdrückung: Heikin Ashi filtert Marktrauschen heraus, was es einfacher macht, in Gewinn-Trades zu bleiben.
- 🕯️ Duale Chart-Ansicht: Behalten Sie Ihre Standardkerzen für Kursbewegungen/Muster bei, während Sie das HA-Overlay für die Trendrichtung verwenden.
- 🎨 Vollständig anpassbar: Passen Sie die Deckkraft und Farben an Ihren Arbeitsbereich (Dunkel- oder Hellmodus) an.
- 🚀 Sofortige Trendidentifikation: Blaue (bullische) und rote (bärische) Zonen helfen Ihnen, Trades gegen das Momentum zu vermeiden.
Hauptmerkmale:
- Intelligente Transparenz: Stellen Sie die Deckkraft so ein, dass das Overlay Ihre Hauptkursbewegung nicht verdeckt.
- Perfekte Ausrichtung: In Echtzeit berechnet, um die Heikin Ashi Werte des aktuellen Zeitrahmens anzupassen.
- Professionelles Design: Saubere Visuals, die Ihren Chart nicht überladen.
- Universell: Funktioniert auf allen Zeitrahmen (M1 bis Monatlich) und allen Assets (Forex, Aktien, Krypto, Indizes).
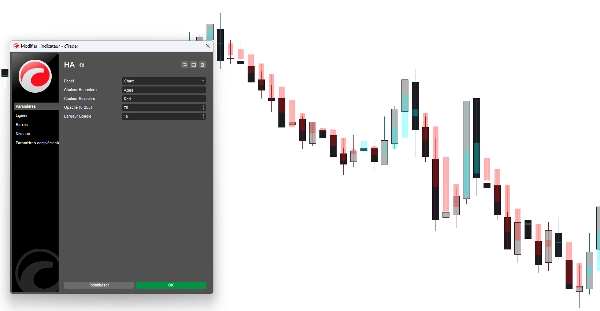
Anwendung:
- Wenden Sie den Indikator auf Ihren Chart an.
- Passen Sie die Deckkraft und Kerzenbreite in den Einstellungen nach Ihren Vorlieben an.
- Verwenden Sie die HA-Kerzen, um die Trendstärke zu bestätigen:
-
- Lange Dochte in Trendrichtung = Starkes Momentum.
- Kleine Körper mit Dochten auf beiden Seiten = Potenzielle Umkehr.
Parameter:
- Bullische Farbe: Benutzerdefinierte Farbe für aufwärts gerichtete HA-Kerzen.
- Bärische Farbe: Benutzerdefinierte Farbe für abwärts gerichtete HA-Kerzen.
- Deckkraft (0-255): Steuert, wie "geisterhaft" oder solide die Kerzen erscheinen.
- Kerzenbreite: Passen Sie die Dicke der HA-Kerzen an, um perfekt zu Ihrem Zoom-Level zu passen.
Zusammenfassung
KI-Zusammenfassung
The Pro Heikin Ashi Visual Overlay is an indicator designed to enhance trend analysis by overlaying Heikin Ashi candles on standard candlestick or bar charts. Unlike traditional Heikin Ashi charts that replace the entire chart type, this tool provides a semi-transparent overlay, allowing traders to observe smoothed trend signals while retaining visibility of actual price action.
Key features include noise reduction to filter market fluctuations, customizable opacity and colors for integration with different chart backgrounds, and real-time alignment with the current timeframe’s Heikin Ashi calculations. The overlay uses blue and red zones to indicate bullish and bearish trends, aiding in immediate trend identification. It supports all timeframes from one minute to monthly and is compatible with various asset classes including Forex, stocks, cryptocurrencies, commodities, and indices.
Users can adjust candle width and opacity to suit their chart zoom level and visual preferences. The indicator facilitates dual-chart viewing, enabling simultaneous analysis of precise price patterns and smoothed trend momentum. It is designed with clean visuals to avoid chart clutter and supports professional trading environments.
Indikatorprofil
Kundenbewertungen
4.0
Bewertungen: 1
5 | 0 % | |
4 | 100 % | |
3 | 0 % | |
2 | 0 % | |
1 | 0 % |
Diskussion
Häufig gestellte Fragen (FAQ)
Forex
Signal
Indices
Commodities
Crypto
Stocks
Über den cTrader Store verfügbare Produkte, einschließlich Handelsbots, Indikatoren und Plugins, werden von externen Entwicklern bereitgestellt und nur zu Informations- und technischen Zugriffszwecken verfügbar gemacht. cTrader Store ist kein Broker und erbringt keine Anlageberatung, persönlichen Empfehlungen oder eine Garantie für zukünftige Performance.
Mehr von diesem Autor


![„[Hamster-Coder] Bollinger Bands“-Logo](https://cdn.ctrader.com/image/webp/21d8e5d6-fb11-4bac-b9ee-cd05c2b76804_30327)


![„Gaussian Channel [Iridio Capital]“-Logo](https://cdn.ctrader.com/image/webp/7c039209-5573-4a54-a072-f9528b503103_41960)


Preis
Seit 27/10/2025
10
Verkäufe