
TradingViewMACD
Indikator
3 käufe
Version 1.0, Feb 2025
Windows, Mac
5.0
Bewertungen: 1

Beschreibung
TradingViewMACD Indikator
Verbessern Sie Ihre Handelsstrategie mit unserem hochgradig anpassbaren TradingViewMACD Indikator, der für die cAlgo-Plattform entwickelt wurde. Dieses leistungsstarke Tool kombiniert die Flexibilität und Präzision, die zur Optimierung Ihrer Marktanalyse erforderlich sind.
Hauptmerkmale:
- Anpassbare Parameter:
-
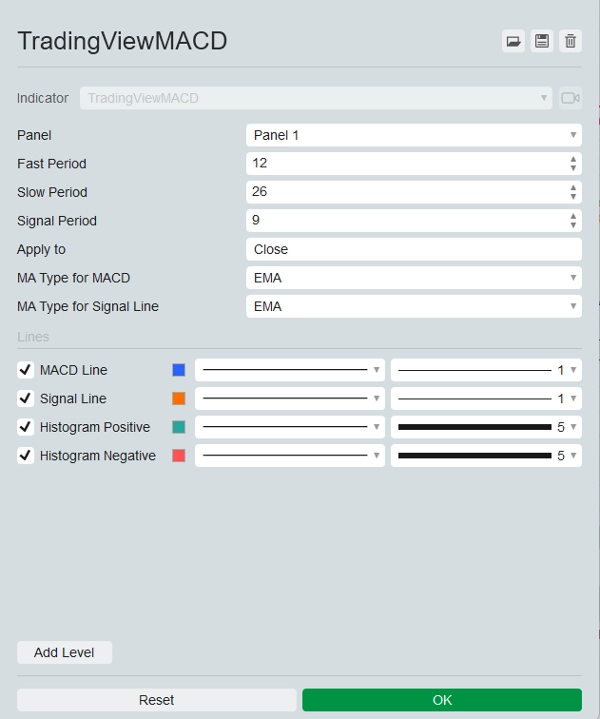
- Schnelle Periode: Passen Sie die Periode des schnellen gleitenden Durchschnitts an Ihren Handelsstil an.
- Langsame Periode: Konfigurieren Sie die Periode des langsamen gleitenden Durchschnitts für eine verbesserte Signalgenauigkeit.
- Signalperiode: Legen Sie die Periode der Signallinie fest, um Ihre Ein- und Ausstiegspunkte fein abzustimmen.
- Angewandter Preis: Wählen Sie aus Open, High, Low, Close, Median, Typical oder Weighted Preisen, um den Indikator anzuwenden.
- Mehrere Typen gleitender Durchschnitte:
-
- Wählen Sie zwischen einfachem gleitenden Durchschnitt (SMA) und exponentiellem gleitenden Durchschnitt (EMA) sowohl für die MACD-Linie als auch für die Signallinie, um Flexibilität in Ihrer Analyse zu gewährleisten.
- Visuelle Ausgaben:
-
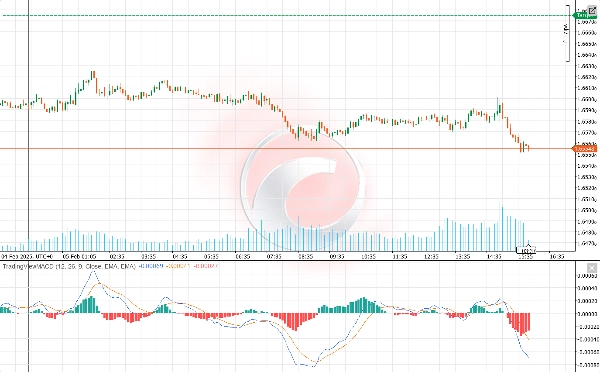
- MACD-Linie: Wird in einem auffälligen Blau angezeigt für klare Sichtbarkeit.
- Signallinie: Hervorgehoben in lebhaftem Orange, um sie leicht von der MACD-Linie zu unterscheiden.
- Histogramm: Unterscheidet zwischen positiven und negativen Werten mit grünen bzw. roten Farben und bietet eine klare visuelle Darstellung der Marktdynamik.
- Verbesserte Markteinblicke:
-
- Der Indikator berechnet die Differenz zwischen dem schnellen und dem langsamen gleitenden Durchschnitt, um die MACD-Linie zu erzeugen.
- Berechnet die Signallinie als gleitenden Durchschnitt der MACD-Linie.
- Das Histogramm stellt visuell die Differenz zwischen der MACD-Linie und der Signallinie dar und hilft Ihnen, potenzielle Kauf- und Verkaufssignale zu identifizieren.
- Benutzerfreundlich:
-
- Einfach zu installieren und zu konfigurieren, sodass Händler aller Erfahrungsstufen von seinen fortschrittlichen Funktionen profitieren können.
- Umfassende Dokumentation und Kundensupport für ein nahtloses Erlebnis.
Entfesseln Sie das volle Potenzial Ihrer Handelsstrategie mit dem TradingViewMACD Indikator. Verbessern Sie Ihre Marktanalyse, treffen Sie fundierte Entscheidungen und bleiben Sie mit diesem unverzichtbaren Handelswerkzeug der Konkurrenz voraus.
Zusammenfassung
KI-Zusammenfassung
The TradingViewMACD indicator for the cAlgo platform is a customizable technical analysis tool designed to enhance market analysis. It calculates the difference between fast and slow moving averages to generate the MACD line, computes a signal line as the moving average of the MACD line, and displays a histogram representing the difference between these lines to help identify potential buy and sell signals.
Key features include adjustable parameters such as fast period, slow period, signal period, and applied price (open, high, low, close, median, typical, or weighted). Users can select between Simple Moving Average (SMA) and Exponential Moving Average (EMA) types for both the MACD and signal lines, providing analytical flexibility.
Visual outputs consist of a blue MACD line, an orange signal line, and a histogram with green and red colors indicating positive and negative momentum, respectively. The indicator is designed for ease of installation and configuration, supported by comprehensive documentation and customer support to accommodate traders of all experience levels.
Indikatorprofil
Kundenbewertungen
5.0
Bewertungen: 1
5 | 100 % | |
4 | 0 % | |
3 | 0 % | |
2 | 0 % | |
1 | 0 % |
Kundenbewertungen
November 9, 2025
TradingView MACD brings the familiar feel straight to cTrader 🚀 - smooth, light, and 100% accurate to the original. Perfect for traders switching from TV who love clean momentum signals. Missing alerts, but flawless for classic trend and divergence play.
Diskussion
Häufig gestellte Fragen (FAQ)
Signal
MACD
Über den cTrader Store verfügbare Produkte, einschließlich Handelsbots, Indikatoren und Plugins, werden von externen Entwicklern bereitgestellt und nur zu Informations- und technischen Zugriffszwecken verfügbar gemacht. cTrader Store ist kein Broker und erbringt keine Anlageberatung, persönlichen Empfehlungen oder eine Garantie für zukünftige Performance.


Preis
Seit 22/11/2024
133
Verkäufe
2.58K
Kostenlose Installationen