
Descrição
VWAP (Preço Médio Ponderado por Volume) é um parâmetro de negociação que calcula o preço médio de um ativo ajustado pelo volume de negociação durante um período especificado. É amplamente utilizado por traders diários, instituições e sistemas de negociação algorítmica para avaliar o valor justo e otimizar a execução das negociações.
Fórmula Principal:
VWAP=∑(Price×Volume)/∑Volume
- Preço = Preço típico (Alta + Baixa + Fechamento) / 3 ou apenas o preço de fechamento.
- Volume = Volume de negociação para cada período.
2. Por que usar o VWAP?
Propósito:
1)Referência de Valor Justo
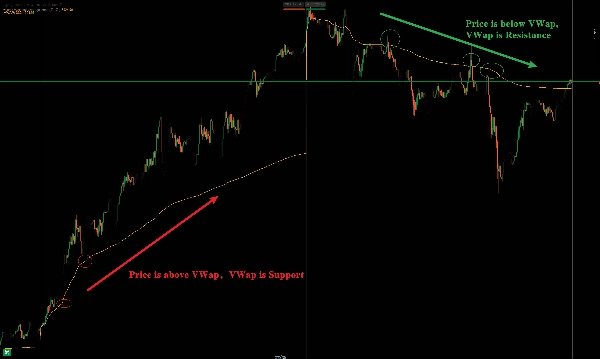
Preço > VWAP = viés de alta; Preço < VWAP = viés de baixa.
2)Suporte/Resistência Dinâmicos
Age como um nível chave para rompimentos/reversões intradiários.
3) Confirmação de Tendência
Preço mantendo-se acima do VWAP = Tendência de alta; Abaixo = Tendência de baixa.
Volume Weighted Average Price (VWAP) 指标详解及用法
1. 基本概念
VWAP(成交量加权平均价) 是一种技术分析工具,用于衡量资产在特定时间段内的平均交易价格,并根据成交量进行加权计算。它帮助交易者判断当前价格相对于市场的“公平价值”,常用于日内交易、算法交易和机构执行订单。
核心公式:
VWAP=∑(Price×Volume)/∑Volume
每条K线的价格 × 成交量累加,再除以总成交量,得到动态加权均价。
2. VWAP 的主要用途
用途:
1)判断市场公允价格
价格高于VWAP = 偏强;低于VWAP = 偏弱。
2)支撑/阻力参考
VWAP常作为短线交易的动态支撑/阻力位。
3)日内趋势确认
价格持续在VWAP上方 = 多头主导;下方 = 空头主导。
Resumo
VWAP serves several key functions: it acts as a reference for fair value, where prices above VWAP indicate bullish bias and below indicate bearish bias; it provides dynamic support and resistance levels useful for intraday breakouts and reversals; and it helps confirm intraday trends, with prices sustained above VWAP signaling an uptrend and below signaling a downtrend.
This indicator supports various markets including forex, stocks, indices, commodities, and cryptocurrencies, making it a versatile tool for intraday market analysis and trading strategy development.


