
説明
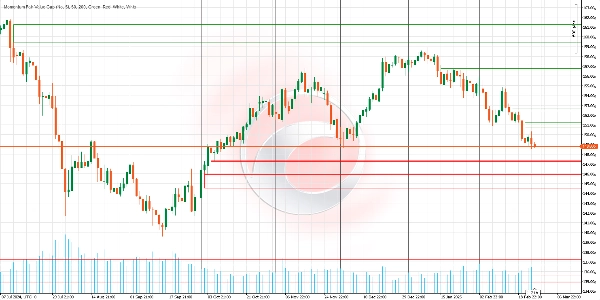
市場の不均衡領域(フェアバリューギャップまたはFVG)を特定し、それらをチャート上にスマートに投影します。他のインジケーターとは異なり、これは価格の動きにリアルタイムで適応し、そのサイズ、持続性、および関連性を調整します。明確なターゲットと高度な視覚的ギャップ管理を求めるトレーダーに最適です。
✨ 主な特徴
- 動的ギャップ調整
ロジック:価格が部分的にFVGに触れた場合(例:下限にかすめる)、インジケーターは自動的にギャップのサイズを未カバー領域のみに調整します。
利点:誤ったシグナルを避け、実際に可能性のあるギャップのみをアクティブに保ちます。 - ミッドポイントフィル
ロジック:ギャップの中央にラインを引きます。価格がこれに触れると、FVGは「埋まった」と見なされ、削除可能(設定可能)となります。
利点:閉鎖確認に50%の接触のみを必要とし、ノイズや早すぎる取引をフィルタリングします。 - 埋まるまで無限投影
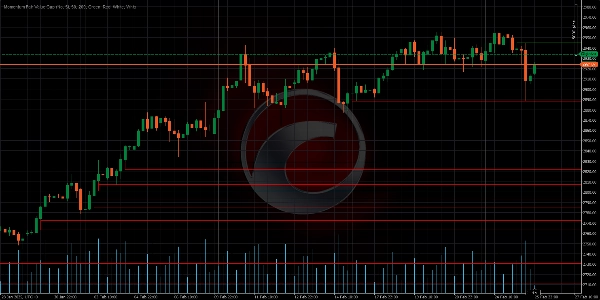
ロジック:ギャップは将来に向かって無期限に延長されます(X本のローソク足後に消えることはありません)。
利点:市場が不均衡を解消するまで持続的な参照を提供します。 - 無効化されたギャップの自動クリーンアップ
ロジック:完全に埋まった古いギャップを自動的に削除します。
利点:チャートをクリーンに保ち、アクティブなゾーンに集中させます。 - 高度な視覚カスタマイズ
オプション:強気(緑)と弱気(赤)のギャップに異なる色を設定可能。チャートの混雑を避けるための透明度調整。
利点:あらゆる取引スタイルや視覚戦略に適応します。
🎯 取引での使い方は?
重要ゾーンの特定:
- 強気FVG(緑):買い手が一時的に力を失ったエリア。
→ 戦略:このゾーンへのプルバック時に買いの機会を探します。 - 弱気FVG(赤):売り手が押し切られたエリア。
→ 戦略:このゾーンへのラリー時に売りの機会を探します。
価格との相互作用:
- ギャップが動的に調整される(サイズが縮小される)場合、市場がゾーンをテストしているが確認は得られていないことを示します。
- ギャップが削除される(完全に埋まるかミッドポイントに触れる)場合、不均衡が修正されたと考えます。
🔍 他のツールとの確認
FVGをサポート/レジスタンス、ボリューム、RSIと組み合わせてシグナルをフィルタリングします。
📋 機能比較
___________________________________________________________________________________
機能 Momentum Fair Value Gap Traditional Indicators
________________________________________________________________________________
持続性---------------- ギャップが埋まるまで延長 ----------------------- X本のローソク足後に消える
閉鎖精度-------- 50%確認オプション --------------------- 完全なギャップ埋めが必要
柔軟性 ------------------ 価格に合わせてサイズ変更 ------------------------- 静的で不変のレベル
視覚的焦点---------------- 無関係なギャップを除去 ----------------------- 過去のデータでチャートが混雑
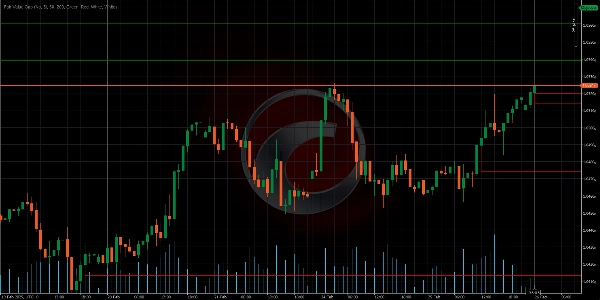
📝 実践例
EURUSD(1時間足)のシナリオ:
顕著な弱気ローソク足の後に強気FVG(緑)が形成されます。数日後、価格は戻り、ギャップの下限に触れますが埋めません。インジケーターは自動的にギャップのサイズを縮小します。最終的に価格がミッドポイント(中央線)に触れ、削除がトリガーされます。トレーダーはゾーンでの拒否を確認後、ショートに入ります。
Ctraderストアのインジケーター:
Dynamic Market Structure
Analysis of Turning Points
Fibonacci Linear
Regression Multi-timeframe
Multi-Level Candle Bias
Tracker
Auto Support and
Resistance Trend Lines
概要
Key features include:
- Dynamic Gap Adjustment: Automatically resizes gaps when price partially touches them, reducing false signals.
- MidPoint Fill: Marks the gap centerline; if price touches it, the gap is considered filled and can be removed, requiring only 50% contact for confirmation.
- Infinite Projection: Gaps extend indefinitely until filled, maintaining persistent market imbalance references.
- Automatic Cleanup: Removes fully filled gaps to keep charts focused on active zones.
- Advanced Visual Customization: Uses distinct colors for bullish (green) and bearish (red) gaps with adjustable transparency.
In trading, bullish FVGs indicate zones where buyers lost strength, suggesting buying opportunities on pullbacks; bearish FVGs mark where sellers were overtaken, indicating selling opportunities on rallies. The indicator’s dynamic interaction with price helps confirm market imbalance resolution.
It is recommended to combine this indicator with other tools like support/resistance levels, volume, or RSI for signal filtering.
カスタマーレビュー
5 | 0 % | |
4 | 100 % | |
3 | 0 % | |
2 | 0 % | |
1 | 0 % |


