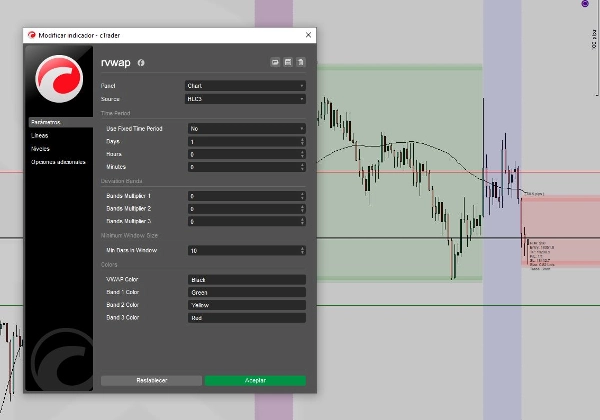
rvwap v1
"rvwap v1" โลโก้
03/09/2025
1
Desktop
ตั้งแต่ 13/01/2025
การขาย
1
"rvwap v1" ภาพที่อัปโหลด

This Rolling VWAP (Volume Weighted Average Price) indicator for cTrader allows traders to visualize VWAP over a dynamic or fixed time period. You can customize the time window using days, hours, and minutes, or let the indicator automatically adjust based on the current chart timeframe. The source price can be selected from options like Close, Open, High, Low, HL2, HLC3, and OHLC4. It includes up to three standard deviation bands above and below the VWAP for identifying potential support and resistance zones. You can also set a minimum number of bars to ensure a reliable calculation even when the time window is short. Ideal for intraday and swing traders seeking dynamic VWAP-based signals and zones of confluence. Includes full color customization for each line. Built for precision, performance, and maximum flexibility.

0.0
รีวิว: 0
รีวิวจากลูกค้า
ยังไม่มีรีวิวสำหรับผลิตภัณฑ์นี้ หากเคยลองแล้ว ขอเชิญมาเป็นคนแรกที่บอกคนอื่น!
เพิ่มเติมจากผู้เขียนคนนี้
Pips V4Final
Displays pips from daily open with high/low. Clean, customizable, perfect for quick daily price context.
RISK V1
Automated position sizing based on risk, entry, and stop loss with ATR support and visual trade setup on charts.
นอกจากนี้คุณยังอาจชอบ
Leverage Liquidation Map
📊 Liquidation Map: Potential areas where highly leveraged investors might face liquidations.
VegaXLR - Market Sessions Alerts
The cTrader Market Sessions Alerts Indicator marks global sessions, highlights key levels, and sends real-time alerts.
Quantitative Qualitative Estimation
The QQE (Quantitative Qualitative Estimation) Weighted Oscillator improves its original version by weighting the RSI.
ยอดนิยม
$ 15
/
$25
BOS & CHOCH
Market structural patterns , specifically the concepts of Change of Character (ChoCH) 🔄 and Break of Structure (BoS) 💥
TwoSMA.cs
An indicator that accurately shows the trend direction. A vital tool for clear trading decisions.
PulseTracker
Version 1.2: Advanced Trend Detection & Visualization System
IR VLine
don't move to the end of chart after timeframe changing. it should be better to use for near history. for long history
Volume Profile Triple Line - POC Median Mode
The Advanced Volume Profile Indicator calculates POC, Median, and Mode, revealing key price levels for smarter trading.
ยอดนิยม
$ 15
FiboTrend-Pro
😎Read the description before purchasing💩
ICT MACRO THEORY
Are essentially short intervals during which the algorithm seeks liquidity or adjusts price.....
Reversal Probability Engine
Detecting reversal zones + multidimensional mapping of support and resistance "Golden Levels.
ยอดนิยม
$ 15
อินดิเคเตอร์
NAS100
NZDUSD
Martingale
+22
Candle Timer
Candle Timer best used for Scalper
New Way Sar - Free
The Parabolic SAR, or "Stop and Reverse," is a dynamic technical analysis tool
เรตติ้งสูง
ฟรี
PMAX
It's a combination of two trailing stop loss and the other one is well-known ATR-based SuperTrend.
ยอดนิยม
$ 15
Parabolic RSI Alert  V1
Master RSI reversals with Parabolic SAR precision! Get real-time alerts for high-probability trend changes.
Chart Overview
ChartOverview – The Comprehensive Market Snapshot