
คำอธิบาย
ตัวชี้วัด cAlgo ที่ให้มา, AutoPositionSizingRR, ถูกออกแบบมาเพื่อช่วยเทรดเดอร์ในการคำนวณและจัดการขนาดตำแหน่งโดยอัตโนมัติตามความเสี่ยง ระดับหยุดขาดทุน และระดับทำกำไร สามารถปรับแต่งได้และสามารถนำไปใช้ได้ทั้งในตลาดหุ้นและฟอเร็กซ์ โดยให้ข้อมูลรายละเอียดเกี่ยวกับการตั้งค่าการเทรด นี่คือการสรุปฟังก์ชันหลักและคุณสมบัติของมัน:
คุณสมบัติหลัก:
- การกำหนดขนาดตำแหน่งตามความเสี่ยง: คำนวณขนาดล็อตที่เหมาะสมตามจำนวนความเสี่ยงที่ระบุและระยะห่างระหว่างราคาที่เข้าซื้อกับจุดหยุดขาดทุน
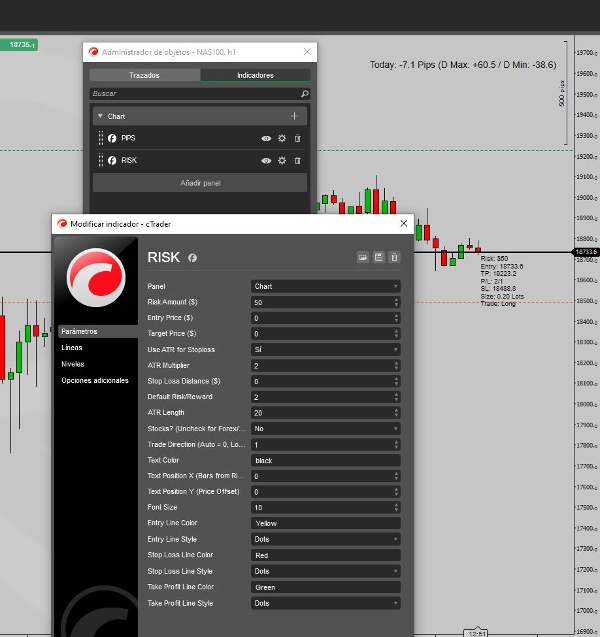
- พารามิเตอร์ที่ปรับแต่งได้: ผู้ใช้สามารถตั้งค่าพารามิเตอร์ เช่น จำนวนความเสี่ยง ราคาที่เข้าซื้อ ราคาที่ตั้งเป้า ระยะหยุดขาดทุน ตัวคูณ ATR และอื่นๆ เพื่อให้เหมาะสมกับการจัดการความเสี่ยงเฉพาะตัว
- หยุดขาดทุนและทำกำไรแบบไดนามิก: สามารถคำนวณจุดหยุดขาดทุนและทำกำไรโดยอิงจากระยะห่างคงที่, ATR (ช่วงความผันผวนเฉลี่ยจริง), หรืออัตราส่วนความเสี่ยง/ผลตอบแทนที่กำหนดไว้ล่วงหน้า
- รองรับฟอเร็กซ์และหุ้น: รองรับทั้งตลาดฟอเร็กซ์และหุ้น โดยปรับการคำนวณตามเครื่องมือที่ทำการเทรด
- การตั้งค่าด้วยภาพ: วาดเส้นแนวนอนบนกราฟสำหรับจุดเข้าซื้อ จุดหยุดขาดทุน และจุดทำกำไร เพื่อให้เห็นภาพการตั้งค่าการเทรดได้ง่าย นอกจากนี้ยังแสดงข้อมูลสำคัญ เช่น ราคาที่เข้าซื้อ จุดหยุดขาดทุน จุดทำกำไร ขนาดล็อต และประเภทการเทรดโดยตรงบนกราฟ
วิธีการทำงาน:
- อินพุต: ผู้ใช้ตั้งค่าจำนวนความเสี่ยง (เป็น USD), ราคาที่เข้าซื้อ, ราคาที่ตั้งเป้า และระยะหยุดขาดทุน (ทั้งแบบคงที่หรืออิงจาก ATR) โดย ATR (ช่วงความผันผวนเฉลี่ยจริง) สามารถใช้สำหรับคำนวณระยะหยุดขาดทุนในตลาดที่มีความผันผวนสูง
- การคำนวณ: สคริปต์จะคำนวณขนาดตำแหน่งโดยอัตโนมัติ โดยการหารจำนวนความเสี่ยงด้วยระยะหยุดขาดทุน (เป็นพิปหรือมูลค่าเงินดอลลาร์ ขึ้นอยู่กับว่าการเทรดเป็นฟอเร็กซ์หรือหุ้น)
- ข้อมูลการเทรด: แสดงข้อมูลแบบเรียลไทม์บนกราฟ เช่น ราคาที่เข้าซื้อ จุดหยุดขาดทุน จุดทำกำไร และขนาดล็อตที่ต้องการเพื่อรักษาระดับความเสี่ยงที่กำหนด
คุณสมบัติด้านภาพ:
- เส้นกราฟ: วาดระดับเข้าซื้อ จุดหยุดขาดทุน และจุดทำกำไรเป็นเส้นแนวนอนบนกราฟ
- ข้อความซ้อนทับ: แสดงรายละเอียดการเทรดที่จัดรูปแบบแล้ว (ความเสี่ยง, เข้าซื้อ, TP, SL, ขนาดล็อต ฯลฯ) บนกราฟ พร้อมการปรับตำแหน่งข้อความ สี และขนาดตัวอักษรได้
การใช้งาน:
- ตัวชี้วัดนี้เหมาะสำหรับเทรดเดอร์รายวัน, เทรดเดอร์สวิง และสแคปเปอร์ที่ต้องการทำให้กระบวนการคำนวณขนาดตำแหน่งโดยอัตโนมัติตามเกณฑ์ความเสี่ยงที่กำหนดไว้ ง่ายต่อการจัดการการเทรดโดยให้สัญญาณภาพและข้อมูลการเทรดโดยตรงบนกราฟ ซึ่งช่วยให้การตัดสินใจมีประสิทธิภาพมากขึ้น
ตัวอย่าง:
- เทรดเดอร์สามารถตั้งค่าจำนวนความเสี่ยงที่ $50, ราคาที่เข้าซื้อที่ $100, และใช้ ATR สำหรับการคำนวณจุดหยุดขาดทุน สคริปต์จะคำนวณขนาดตำแหน่งที่เหมาะสม วาดระดับเข้าซื้อ จุดหยุดขาดทุน และจุดทำกำไรบนกราฟ และแสดงรายละเอียดการเทรดสำคัญ เช่น จำนวนความเสี่ยง จุดหยุดขาดทุน และกำไรที่เป็นไปได้
เครื่องมือนี้เหมาะสำหรับเทรดเดอร์ที่ให้ความสำคัญกับการจัดการความเสี่ยงและต้องการวิธีการจัดการการเทรดที่ผสานรวมกับภาพอย่างชัดเจน
สรุป
โปรไฟล์อินดิเคเตอร์
รีวิวจากลูกค้า
5.0
รีวิว: 1
5 | 100 % | |
4 | 0 % | |
3 | 0 % | |
2 | 0 % | |
1 | 0 % |
รีวิวจากลูกค้า
April 29, 2025
it helps the review without running the trade, but it should stay as one part of the stack.
การสนทนา
คำถามที่พบบ่อย
Forex
ATR
ผลิตภัณฑ์ที่มีให้บริการผ่าน cTrader Store รวมถึงบอทการเทรด อินดิเคเตอร์ และปลั๊กอิน มีให้บริการโดยนักพัฒนาบุคคลที่สามและมีไว้เพื่อวัตถุประสงค์ในการเข้าถึงข้อมูลและทางเทคนิคเท่านั้น cTrader Store ไม่ใช่โบรกเกอร์และไม่ได้ให้คำแนะนำการลงทุน คำแนะนำส่วนบุคคล หรือการรับประกันผลการดำเนินงานในอนาคต
เพิ่มเติมจากผู้เขียนคนนี้


!["[Stellar Strategies] MARSI Signal Plotter" โลโก้](https://cdn.ctrader.com/image/webp/7b2b8da6-8f8e-4646-8d4a-4710c516c01e_25567)


ราคา
ตั้งแต่ 13/01/2025
2
การขาย