
Opis
📈 PineScriptLabs Smart Signals CDRC [Auto TP/SL]
❓ Czym jest ten wskaźnik?
System Dynamic Close Range Channels (CDRC) jest wskaźnikiem opracowanym w ramach teorii PineScriptLabs, który wykorzystuje dwa niezależne kanały do generowania sygnałów kupna/sprzedaży 📊 oraz automatycznego obliczania dynamicznych celów zysku (TP) i stop loss (SL) 🎯, które są zawsze inne.
🎯 Specjalny dynamiczny algorytm TP/SL ⚡
W przeciwieństwie do systemów używających stałych poziomów lub ATR, ten algorytm oblicza TP i SL na podstawie rzeczywistego ruchu cenowego od ostatniego sygnału:
• Dla LONG 📈: Mierzy odległość od najniższej zanotowanej ceny do wejścia, oblicza procent tego ruchu, i projekcjonuje ten sam procent w górę w celu ustalenia celów
• Dla SHORT 📉: Mierzy odległość od najwyższej zanotowanej ceny do wejścia, i projekcjonuje ten procent w dół
🎯 Oznacza to, że każda transakcja ma unikalne poziomy dostosowane do konkretnego kontekstu rynkowego w danym momencie, odzwierciedlając rzeczywisty impet przed sygnałem 💡
📊 Teoria CDRC: Konstrukcja kanału 🏗️
Podstawa techniczna 🔍
Teoria CDRC buduje kanały wyłącznie na podstawie zakresów cen zamknięcia, a nie na zmienności czy odchyleniu standardowym. Zamknięcia odzwierciedlają rzeczywisty konsensus rynkowy i eliminują szumy knotów 🎯
Proces konstrukcji ⚙️
- Średnia cena: Średnia wszystkich zamknięć okresu
- Zakres: Różnica między najwyższym a najniższym zamknięciem okresu
- Amplituda: Zakres × Mnożnik ÷ 2
- Pasma:
o Górne = Średnia cena + Amplituda ↗️
o Dolne = Średnia cena - Amplituda ↘️
🔄 Kanały są przeliczane na każdej świecy, stale dostosowując się do rynku
⚙️ Jak to działa?
Dwa jednoczesne kanały 📊📊
• Kanał 1 (Szybki - 111 świec): Reaguje szybko na zmiany, mnożnik 0.14 ⚡
• Kanał 2 (Wolny - 388 świec): Wizja długoterminowa, mnożnik 0.11 🐢
Generowanie sygnałów 🎯
• LONG ✅: Cena zamyka się powyżej górnego pasma OBU kanałów przez 2 kolejne świece 🟢
• SHORT ✅: Cena zamyka się poniżej dolnego pasma OBU kanałów przez 2 kolejne świece 🔴
🛡️ Podwójne potwierdzenie filtruje fałszywe sygnały
🤖 Automatyczne obliczanie TP/SL (szczegóły algorytmu)
Dla LONG 📈:
- System nieustannie rejestruje najniższą cenę od ostatniego sygnału
- Przy generowaniu sygnału kupna oblicza: Procent = (Wejście - Minimum) / Wejście × 100
- Projekcjonuje ten procent w górę od wejścia, aby ustalić TP3
- Dzieli zakres na trzy strefy: TP1 (33%), TP2 (66%), TP3 (100%)
- SL = Wejście - (Wejście × Procent × Współczynnik Stop Loss / 100)
Dla SHORT 📉:
- System nieustannie rejestruje najwyższą cenę od ostatniego sygnału
- Przy generowaniu sygnału sprzedaży oblicza: Procent = (Maksimum - Wejście) / Wejście × 100
- Projekcjonuje ten procent w dół od wejścia, aby ustalić TP3
- Dzieli zakres na trzy progresywne strefy
- SL = Wejście + (Wejście × Procent × Współczynnik Stop Loss / 100)
🎯 Wynik: Każda transakcja ma unikalne poziomy obliczone zgodnie z konkretnym impetem rynku w danym momencie
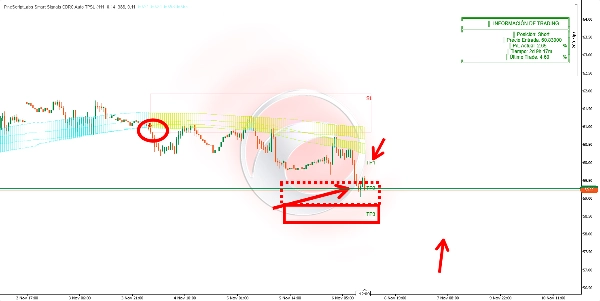
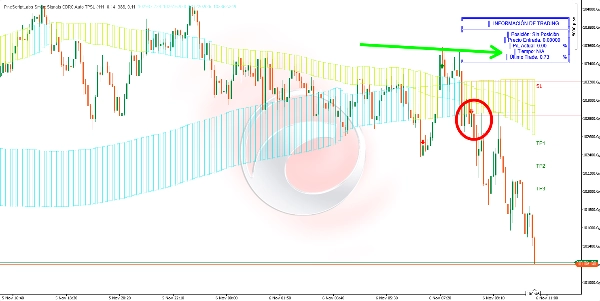
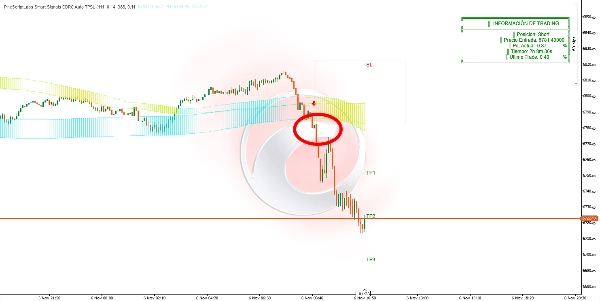
👀 Wizualizacja 🎨
• Punkty: Pasma obu kanałów
• Dynamiczne wypełnienie: Kanały zmieniają kolor po przebiciu
• Pudełka: Strefa wejścia (SL-Wejście) i trzy strefy celów (progresywne przezroczystości)
• Etykiety: SL, TP1, TP2, TP3 z dokładnymi cenami 🏷️
• Strzałki: Zielone (kupno) 🟢 / Czerwone (sprzedaż) 🔴
• Tabela: Aktualna pozycja, cena wejścia, aktualny P/L %, czas w transakcji, ostatnia zamknięta transakcja 📋
🎯 Do czego to służy?
- Wysokie prawdopodobieństwo wejść z potwierdzeniem na dwóch ramach czasowych ✅
- Adaptacyjne automatyczne zarządzanie ryzykiem oparte na rzeczywistym ruchu rynku 🤖
- Unikalne, stopniowane cele dla każdej transakcji zgodnie z poprzednim impetem 🎯
- Dynamiczna adaptacja do ostatniego zachowania cen 🔄
- Monitorowanie w czasie rzeczywistym wyników pozycji 📊
🛠️ Jak z tego korzystać?
Wejście 🚀: Wejdź na zamknięciu świecy, gdy pojawi się strzałka
Zarządzanie 💼:
• TP1: 33% prognozowanego ruchu (częściowe zyski) 💰
• TP2: 66% ruchu (więcej zysków) 💰💰
• TP3: 100% ruchu (ostateczny cel) 🎯
• SL: Zawsze respektuj automatyczny stop loss ⛔
Monitorowanie 👀: Tabela pokazuje aktualny P/L w czasie rzeczywistym. System automatycznie wykrywa osiągnięcie TP3 lub SL. Tylko jeden aktywny sygnał na raz ⚠️
⚙️ Parametry i wpływ
Okres kanału 1 (111):
• ↑ Więcej świec = Mniej sygnałów, bardziej wiarygodne, wolniejsze 🐢
• ↓ Mniej świec = Więcej sygnałów, szybsze, bardziej czułe ⚡
Mnożnik kanału 1 (0.14):
• ↑ Wyższy = Szerokie pasma, mniej sygnałów, tylko silne ruchy 💪
• ↓ Niższy = Wąskie pasma, więcej sygnałów, większa czułość 🎯
Okres kanału 2 (388):
• ↑ Wyższy = Ścisłe potwierdzenie, mniej sygnałów 🛡️
• ↓ Niższy = Więcej sygnałów, mniej filtracji 📊
Mnożnik kanału 2 (0.11):
• ↑ Wyższy = Ścisła filtracja, konserwatywny 🎯
• ↓ Niższy = Większa czułość, więcej transakcji ⚡
Współczynnik Stop Loss (50%):
• 50% = stosunek 1:2 (profesjonalna równowaga: ryzyko 1, zysk 2) ⚖️
• ↑ W kierunku 100% = Szeroki SL, większe ryzyko, mniej stopów, gorszy stosunek R:R 📉
• ↓ W kierunku 1% = Ścisły SL, mniejsze ryzyko, lepszy stosunek R:R, więcej stopów 📈
🔑 Kluczowe uwagi
• Pamięć rynku 🧠: Rejestruje ekstremalne ceny od ostatniego sygnału dla realistycznych i unikalnych projekcji
• TP/SL nigdy nie są równe ⚖️: Każda transakcja ma poziomy obliczone zgodnie z jej specyficznym kontekstem
• Obowiązkowe podwójne potwierdzenie przez 2 kolejne świece ✅✅
• Tylko jeden aktywny sygnał na raz ⚠️
• Kanały są stale przeliczane dostosowując się do rynku 🔄
• Pudełka są wizualnie rozszerzane aby zachować widoczność 👀
🚀 Ponad 10 000 traderów już korzysta z naszych NAJLEPSZYCH wskaźników🏆
👉 Pobierz wszystkie nasze NAJLEPSZE systemy tutaj:
_______________________________________________
📌 Wskaźniki struktury rynku
· ✅ AdvancedMarket Structure: Bos, Choch, SwinLevels, Order Blocks, Market Structure& Liquidity Finder
· 🔄 Dynamic Market StructureAnalysis of Turning Points
· 🧱 Order Block
· ⚖️ Market Imbalance
· ⛓️ BOS & CHOCH
· 🧠 ICT Power of 3
_______________________________________________
🔚 Systemy inteligentnego wyjścia
_______________________________________________
📐 Wskaźniki ZigZag
· 🔍 ZigZag Price LiquidityProjection
· ➖ ZigZag
_______________________________________________
🧱 Wskaźniki wsparcia i oporu
· 🟩 SmartTrend Support &Resistance Lines
· 🧱 All Support and ResistanceLevels
_______________________________________________
📊 Wskaźniki trendu i kanału
· 📊 Supertrend
_______________________________________________
💧 Narzędzia wolumenu i płynności
_______________________________________________
⚡ Wskaźniki momentum i RSI
· 🔎 Multi-Level Candle Bias
Tracker
_______________________________________________
🔮 Narzędzia prognozowania i projekcji
· 📐 Prediction Based on Linreg& ATR
· 📏 Fibonacci Linear RegressionMulti-timeframe
· 📈 Volume-Powered Market Flow Projector
Podsumowanie
Opinie klientów
5 | 67 % | |
4 | 0 % | |
3 | 33 % | |
2 | 0 % | |
1 | 0 % |


