
Opis
Zrewolucjonizuj swoją analizę wykresów
Wejdź w przyszłość analizy technicznej z Delta-RSI Candle Pro – innowacyjnym wskaźnikiem, który przekształca zwykłe świece w potężne wizualizatory momentum. Po co zaśmiecać ekran wieloma wskaźnikami, skoro wszystko, czego potrzebujesz, masz bezpośrednio na świecach?
Wszechstronne wizualne rozwiązanie tradingowe
-
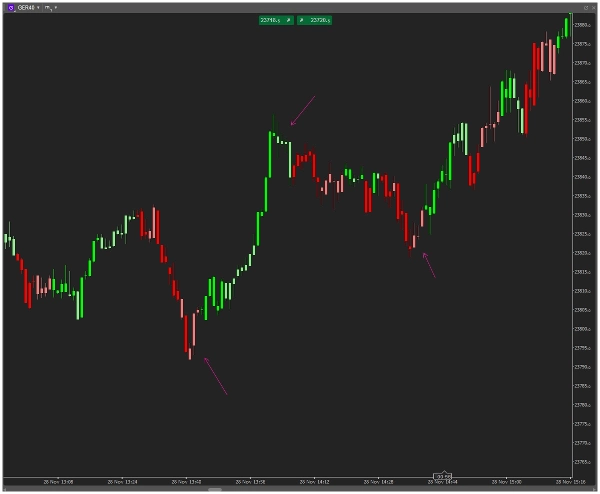
- Natychmiastowe rozpoznawanie sygnałów: Siła i kierunek momentum wyświetlane intuicyjnie za pomocą kolorów
- Maksymalizacja przestrzeni ekranu: Eliminacja oddzielnych paneli oscylatorów na zawsze
- Matematyczna precyzja: Zaawansowana regresja wielomianowa oblicza prawdziwe momentum RSI
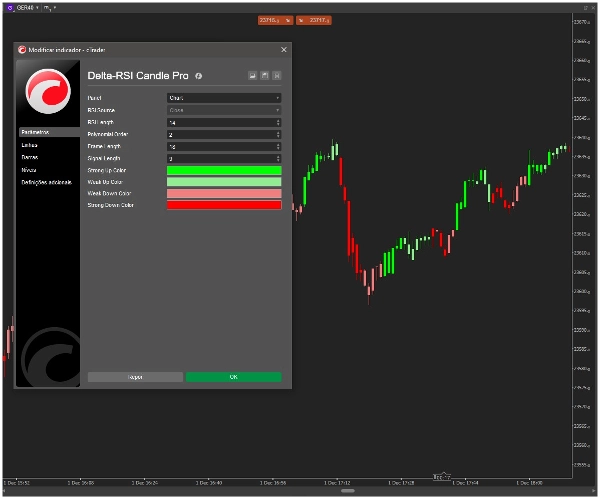
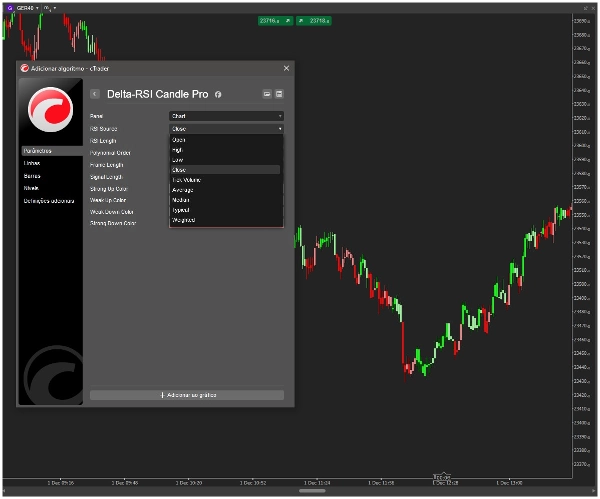
- Pełna personalizacja: Użyj natywnych selektorów kolorów cTrader, aby dopasować styl tradingu
- Niezawodność i dokładność: Obliczenia bez przerysowywania oparte na potwierdzonych danych cenowych
Jak działa Delta-RSI Candle Pro
Nasz własny algorytm oblicza chwilową pochodną RSI za pomocą dopasowania krzywej wielomianowej, a następnie przypisuje inteligentne kolory do każdej świecy:
-
- Silny byczy: Intensywna zieleń – dodatnie momentum przyspiesza
- Łagodny byczy: Jasna zieleń – dodatnie momentum, ale zalecana ostrożność
- Łagodny niedźwiedzi: Jasna czerwień – ujemne momentum, ale potencjalne odwrócenie
- Silny niedźwiedzi: Głęboka czerwień – ujemne momentum przyspiesza
Kluczowe cechy, które nas wyróżniają
-
- 🎯 Bezpośrednia integracja ze świecami: Kolory pojawiają się bezpośrednio na twoich świecach tradingowych
- 🎨 Wizualny wybór kolorów: Intuicyjne selektory kolorów cTrader – bez potrzeby kodów nazw
- ⚙️ W pełni regulowany: Dostosuj długość RSI, rząd wielomianu i okres lookback
- 🚀 Optymalna wydajność: Lekki silnik obliczeniowy dla płynnej pracy
- 📊 Algorytm klasy profesjonalnej: Matematyczna analiza pochodnej dla lepszych sygnałów
Kto odnosi największe korzyści?
-
- Day Traderzy potrzebujący natychmiastowych wizualnych wskazówek momentum
- Swing Traderzy identyfikujący wczesne zmiany trendu
- Minimalistyczni Traderzy którzy nie lubią zaśmiecania wykresów
- Traderzy algorytmiczni poszukujący wizualnego potwierdzenia
- Wszyscy poważni traderzy chcący mieć przewagę w analizie rynku
Rozpocznij w kilka sekund
-
- Dodaj Delta-RSI Candle Pro do swojego wykresu
- Wybierz preferowane kolory za pomocą wizualnych selektorów
- Dostosuj parametry do swojego interwału tradingowego
- Natychmiast zobacz pojawiające się wzorce momentum na świecach
Techniczna doskonałość
-
- Wskaźnik nakładkowy (bez oddzielnego panelu)
- Algorytm bez przerysowywania
- Obliczanie pochodnej wielomianowej RSI
- Kompatybilny ze wszystkimi symbolami i interwałami czasowymi
- Regularne aktualizacje i ulepszenia
Podczas gdy inne wskaźniki dodają złożoność, Delta-RSI Candle Pro upraszcza i wzmacnia. Wykorzystaliśmy zaawansowaną matematyczną analizę momentum i uczyniliśmy ją wizualnie intuicyjną. Koniec z dzieleniem uwagi między cenę a wskaźniki – teraz działają razem jako jeden spójny system.
Gotowy zobaczyć swoje wykresy w rewolucyjny nowy sposób?...
Podsumowanie
Key features include immediate visual signal recognition through candle coloring, elimination of separate oscillator panels to maximize chart space, and advanced mathematical precision with non-repainting calculations based on confirmed price data. Users can fully customize colors and parameters such as RSI length, polynomial order, and lookback period using cTrader’s native color pickers.
Delta-RSI Candle Pro is compatible with all symbols and timeframes and is optimized for smooth performance with a lightweight calculation engine. It is suitable for day traders, swing traders, minimalist traders, algorithmic traders, and others seeking clear, integrated momentum analysis without chart clutter. The indicator overlays directly on price candles, providing a cohesive system that combines price and momentum information visually.
Opinie klientów
5 | 100 % | |
4 | 0 % | |
3 | 0 % | |
2 | 0 % | |
1 | 0 % |


