
คำอธิบาย
เครื่องมือแสดงภาพการสนับสนุนและต้านทานของสถาบัน
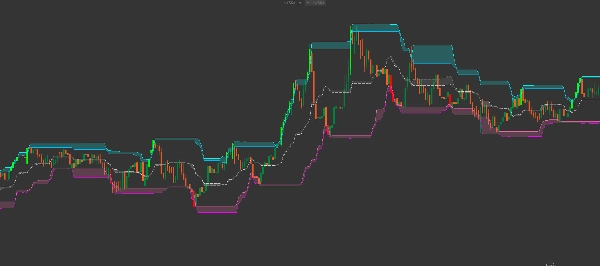
The Smart Donchian Cloud Reversal เป็นช่องความผันผวนรุ่นถัดไปที่ออกแบบมาเพื่อระบุโซนกลับตัวที่มีความน่าจะเป็นสูง แตกต่างจากช่อง Donchian มาตรฐานที่ติดตามเพียงจุดสูงสุดและต่ำสุด ตัวบ่งชี้นี้วิเคราะห์ความสัมพันธ์ระหว่าง ไส้เทียน และ ตัวเทียน เพื่อวาด "เมฆแรงกดดัน"
เมฆเหล่านี้ทำหน้าที่เป็นโซนอุปทานและอุปสงค์ที่เปลี่ยนแปลงได้ แสดงให้คุณเห็นอย่างชัดเจนว่าตลาดมีแนวโน้มที่จะหยุดชะงักหรือกลับตัวที่ใด
สถาปัตยกรรมเมฆหลายชั้นขั้นสูง
ตัวบ่งชี้นี้มีระบบเมฆ 3 ชั้นที่ซับซ้อน:
-
- เมฆต้านทาน (สีฟ้า/น้ำเงิน): อยู่ด้านบน แสดงช่องว่างระหว่างไส้เทียนสูงสุดกับตัวเทียนสูงสุด นี่คือ "โซนขาย"
- เมฆสมดุล (สีเทา/เงิน): ริบบิ้นกลางที่ติดตามความสมดุลของตลาด แสดงค่ากลางที่เป็นธรรมระหว่างไส้เทียนและตัวเทียน
- เมฆสนับสนุน (สีชมพู/ม่วงแดง): อยู่ด้านล่าง แสดงช่องว่างระหว่างไส้เทียนต่ำสุดกับตัวเทียนต่ำสุด นี่คือ "โซนซื้อ"
คุณสมบัติการเทรดหลัก
-
- ตัวกรองความผันผวน ATR: รวมตัวคูณ ATR (Average True Range) ในตัวเพื่อเลื่อนแถบด้านนอกเล็กน้อย กรองเสียงรบกวนของตลาดและ "การล่าหยุด"
- การระบายสีเทียนอัจฉริยะ: ตัวบ่งชี้จะเน้นแรงโมเมนตัมเบรคเอาท์โดยอัตโนมัติ:
- เทียนสีมะนาว: ราคาปิดเหนือเมฆต้านทานบน (เบรคเอาท์ขาขึ้น)
- เทียนสีแดง: ราคาปิดต่ำกว่าเมฆสนับสนุนล่าง (เบรคเอาท์ขาลง)
- ตรรกะไส้เทียนกับตัวเทียน: โดยดูความหนาของ "เมฆ" คุณสามารถประเมินความผันผวน เมฆหนาหมายถึงไส้เทียนยาว (การปฏิเสธ/ลังเลสูง) ขณะที่เมฆบางหมายถึงการเคลื่อนไหวของราคาที่แข็งแกร่งและเด็ดขาด
วิธีการเทรดกับ Smart Donchian Clouds
1. การกลับตัวเฉลี่ย (สเกลปิ้ง) » มองหาราคาที่เข้าสู่ เมฆต้านทาน โดยไม่ปิดเหนือเมฆ นี่มักบ่งชี้ถึง "การหลอกลวง" สัญญาณเข้าระยะสั้นที่มีความน่าจะเป็นสูงกลับไปยังเส้นกลาง
2. การเบรคเอาท์แนวโน้ม » เมื่อเทียนเปลี่ยนเป็น สีมะนาว (ปิดเหนือไส้เทียนบน) สัญญาณว่าฝ่ายกระทิงได้ผ่านโซนต้านทาน นี่คือสัญญาณที่ทรงพลังสำหรับกลยุทธ์ตามแนวโน้ม
3. การเด้งกลับที่สนับสนุน » ดูที่ เมฆสนับสนุน (สีชมพู) เมื่อราคาสัมผัสโซนนี้ในช่วงการดึงกลับของแนวโน้มขาขึ้น นี่คือพื้นที่ "ซื้อที่มีมูลค่า" ที่ผู้ซื้อสถาบันมักเข้ามาแทรกแซง
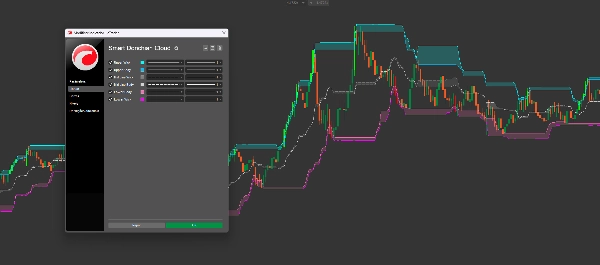
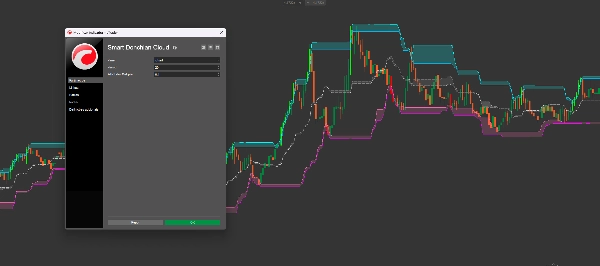
พารามิเตอร์ทางเทคนิค
-
- ช่วงเวลา: ช่วงเวลาย้อนหลังสำหรับคำนวณจุดสูงสุดและต่ำสุด (ค่าเริ่มต้น: 20)
- ตัวคูณตัวกรอง ATR: ปรับ "ช่องว่าง" รอบขอบเขตเพื่อหลีกเลี่ยงการติดอยู่ในจุดสูงสุดเล็กน้อย
- สีที่ปรับแต่งได้เต็มที่: ปรับแต่งเมฆบน กลาง และล่างให้เหมาะกับเทมเพลตชาร์ตส่วนตัวของคุณ
เหตุใดเครื่องมือนี้จึงสำคัญ
เทรดเดอร์ส่วนใหญ่ล้มเหลวเพราะพวกเขามองการสนับสนุนและต้านทานเป็นเส้นเดียว ในความเป็นจริง พวกมันคือ โซน. Smart Donchian Cloud Reversal แสดงแผนที่โซนเหล่านี้ทางคณิตศาสตร์ ให้ภาพโครงสร้างตลาดที่ชัดเจนกว่าตัวบ่งชี้ช่องทางแบบดั้งเดิมใดๆ
สรุป
รีวิวจากลูกค้า
5 | 100 % | |
4 | 0 % | |
3 | 0 % | |
2 | 0 % | |
1 | 0 % |


!["[Hamster-Coder] Moving Average MTF" โลโก้](https://cdn.ctrader.com/image/webp/b11b98b1-194d-4b8e-b00e-d611826ad159_31226)


