Opis
Stochastic Momentum Index (SMI) to ulepszony oscylator stochastyczny zaprojektowany do bardziej płynnego pomiaru momentum niż klasyczny Stochastic. Ta implementacja cTrader odpowiada powszechnie stosowanej formule TradingView poprzez zastosowanie podwójnego wygładzania EMA zarówno do względnego zakresu, jak i zakresu high–low, tworząc czystą, stabilną krzywą momentum, która dobrze działa zarówno w warunkach trendu, jak i konsolidacji.
Co pokazuje
- SMI mierzy, gdzie zamknięcie znajduje się względem środka ostatniego zakresu high–low, znormalizowane i skalowane.
- Wartości zwykle oscylują między -100 a +100.
- Poziomy odniesienia wykupienia/wyprzedania (domyślnie +40 / -40) pomagają zidentyfikować rozciągnięte warunki i ekstremalne momentum.
Wykresy
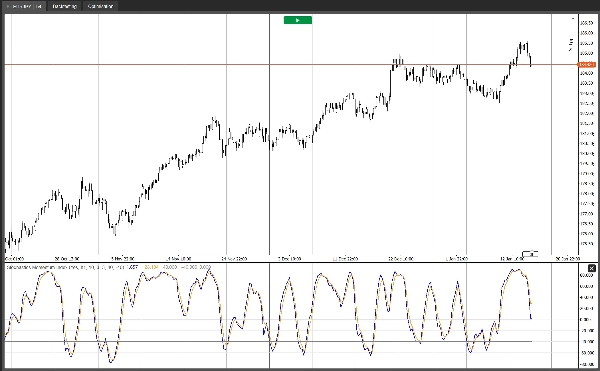
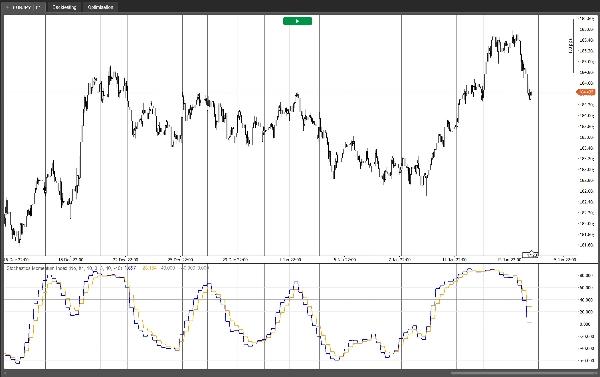
- SMI: główna linia momentum.
- EMA oparta na SMI: linia sygnału (EMA SMI) do przecięć i potwierdzeń.
- Poziomy Wykupienia / Wyprzedania / Środkowy (0) dla szybkiego kontekstu wizualnego.
Jak traderzy go używają
- Reżimy trendu: Używaj linii 0 jako filtru kierunkowego (powyżej 0 = presja wzrostowa, poniżej 0 = presja spadkowa) i handluj cofnięcia za pomocą przecięć SMI z linią sygnału w kierunku trendu.
- Reżimy powrotu do średniej: Odrzucaj ekstremalne wartości, gdy SMI wraca z wykupienia/wyprzedania i potwierdza to przecięciem, często celując w linię 0 jako pierwszy cel powrotu do średniej.
- Divergencje: Dywergencja momentum między ceną a SMI może wskazywać na potencjalne osłabienie ruchów.
Opcja wielookresowa
- Wybierz Źródłowy interwał czasowy do obliczenia SMI z wyższego interwału, wyświetlając go na bieżącym wykresie (idealne do filtrowania szumów i poprawy jakości sygnału).
- Lub włącz Użyj interwału wykresu, aby utrzymać obliczenia na bieżącym interwale.
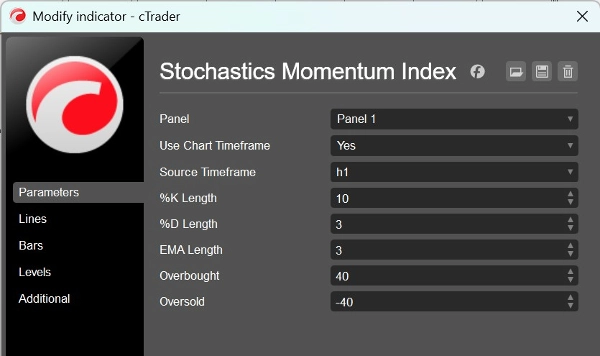
Parametry
- Długość %K: okno wstecz do najwyższego high / najniższego low.
- Długość %D: długość wygładzania używana w podwójnym obliczeniu EMA.
- Długość EMA: długość linii sygnału (EMA SMI).
- Wykupienie / Wyprzedanie: poziomy odniesienia.
- Użyj interwału wykresu / Źródłowy interwał: opcjonalne obliczenia na wyższym interwale.
Ten wskaźnik został zaprojektowany tak, aby był lekki, stabilny i praktyczny dla rzeczywistych procesów handlowych — niezależnie od tego, czy handlujesz kontynuacją trendu, konsolidacjami, czy używasz SMI jako filtra potwierdzającego w szerszej strategii.
Podsumowanie
The indicator plots three key elements: the main SMI momentum line, an EMA-based signal line for crossovers and confirmation, and reference levels for overbought, oversold, and the zero midpoint. Traders use the zero line as a directional filter to identify bullish or bearish pressure and trade pullbacks via SMI and signal line crossovers. It also supports mean-reversion strategies by signaling fades from overbought/oversold conditions and can highlight momentum divergences.
A multi-timeframe option allows calculation of the SMI from a higher timeframe while displaying it on the current chart, helping to filter noise and improve signal quality. User inputs include lookback lengths for %K and %D, signal line EMA length, overbought/oversold levels, and timeframe selection. The indicator is designed for use across various markets including Forex, stocks, commodities, indices, and cryptocurrencies.
Opinie klientów
5 | 50 % | |
4 | 50 % | |
3 | 0 % | |
2 | 0 % | |
1 | 0 % |