Beschreibung
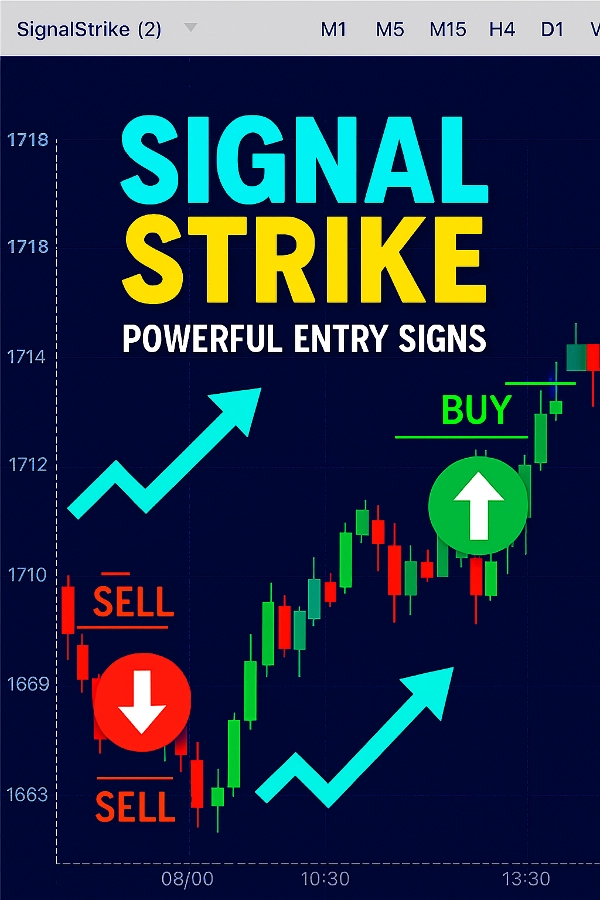
Signal Strike ist ein professioneller Trading-Indikator, der für ctrader entwickelt wurde und klare, hochzuverlässige Einstiegssignale direkt auf Ihrem Chart liefert. Entwickelt mit fortschrittlicher Logik, die Trend, Momentum, Volatilität und Volumenbestätigung kombiniert, hilft dieses Tool Tradern, präzise KAUF- und VERKAUFsmöglichkeiten mit Vertrauen zu identifizieren.
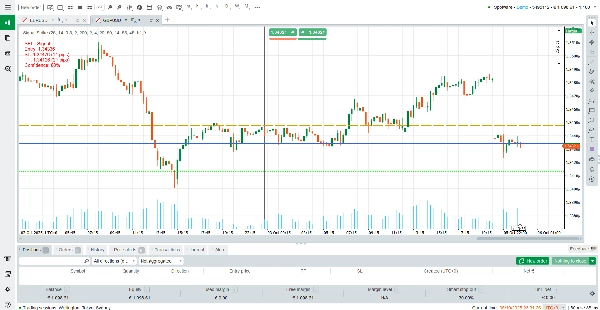
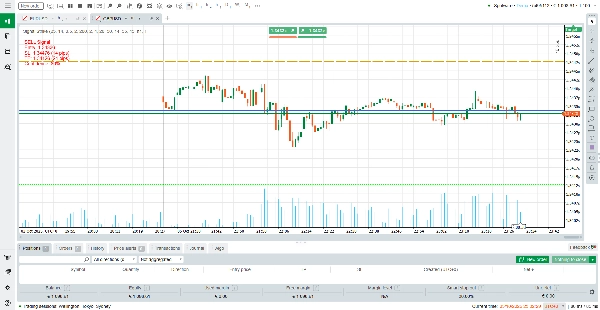
Im Gegensatz zu generischen Indikatoren ist Signal Strike so konzipiert, dass Unentschlossenheitskerzen und schwache Setups herausgefiltert werden. Wenn die Bedingungen erfüllt sind, zeichnet der Indikator Einstiegs-, Stop-Loss- und Take-Profit-Level direkt auf dem Chart, zusammen mit einem Vertrauensprozentsatz. Wenn kein gültiges Setup erkannt wird, zeigt der Indikator „Kein gültiges KAUF/VERKAUF-Signal“ oben im Chart an – so wissen Sie immer genau, wann Sie handeln und wann Sie sich zurückhalten sollten.
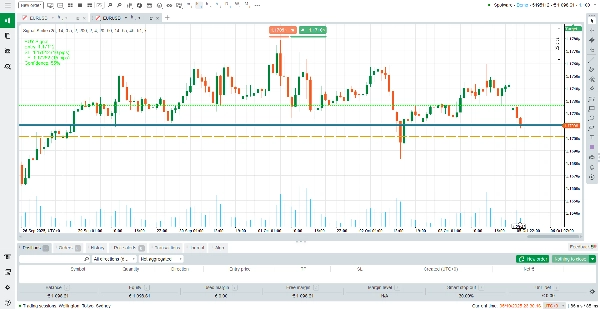
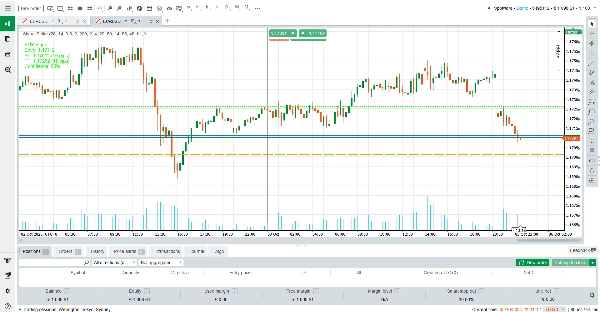
Bei Signal Strike hat jede Linienfarbe eine klare Bedeutung, um Tradern das sofortige Lesen des Charts zu erleichtern. Die Einstiegs-Linie wird in Blau gezeichnet und markiert den genauen Preis, bei dem das Trade-Setup ausgelöst wird. Die Stop-Loss-Linie erscheint in Orange und zeigt das Schutzlevel, bei dem der Trade geschlossen wird, falls sich der Markt gegen Sie bewegt.
Die Take-Profit-Linie wird in Limettengrün angezeigt und hebt das Zielniveau hervor, bei dem Gewinne gesichert werden. Zur besseren Richtungsübersicht werden KAUF-Signale in Grün betont, während VERKAUF-Signale in Rot hervorgehoben sind. Diese starken, gesättigten Farben sorgen dafür, dass jedes Element auffällt und es leicht macht, Einstiegs-, Risiko- und Gewinnzonen auf einen Blick zu unterscheiden.
Wie man die Signale liest
KAUF-Signal: Ein grüner Aufwärtspfeil und ein Label erscheinen, die den Einstiegspreis, Stop-Loss, Take-Profit und das Vertrauensniveau anzeigen.
VERKAUF-Signal: Ein roter Abwärtspfeil und ein Label erscheinen mit denselben Details.
Kein Signal: Wenn die Marktbedingungen nicht stark genug sind, schreibt der Indikator „Kein gültiges KAUF/VERKAUF-Signal“ oben im Chart.
Dynamische TP/SL: Take-Profit- und Stop-Loss-Level werden automatisch basierend auf Volatilität und RSI-Bedingungen angepasst.
Um die Ergebnisse zu maximieren, wird empfohlen, zwischen Zeitrahmen (M1, M5, M15, H1, H4) zu wechseln, um die klarsten Signale für Ihren Trading-Stil zu finden.
Wie der Indikator funktioniert
Signal Strike kombiniert mehrere Analyseebenen:
Trenderkennung.
Momentum-Filter.
Volatilitätsprüfung.
Volumenbestätigung.
Unentschlossenheitsfilter – Kleine, schwache Kerzen werden ignoriert, um falsche Einstiege zu vermeiden.
Nur wenn diese Bedingungen erfüllt sind, generiert der Indikator ein KAUF- oder VERKAUF-Signal. Dies stellt sicher, dass jedes Signal durch mehrere Bestätigungen gestützt wird, wodurch Rauschen reduziert und die Genauigkeit verbessert wird.
Hauptmerkmale (5 Highlights)
Klare Einstiegs-, SL- und TP-Level – Sofort sichtbar auf dem Chart.
Vertrauensprozentsatz – Kennen Sie die Stärke jedes Signals vor dem Einstieg.
Multi-Timeframe-Unterstützung – Funktioniert auf allen Zeitrahmen von M1 bis H4.
Automatische Filterung – Vermeidet falsche Signale während Unentschlossenheit oder Perioden mit geringem Volumen.
Benutzerfreundliche Labels – Leicht zu lesen, mit „Kein Signal“ angezeigt, wenn die Bedingungen nicht erfüllt sind.
Empfohlene Einstellungen nach Zeitrahmen
Der Indikator enthält flexible Eingaben (LookbackCandles, ATRPeriod, ATRMultiplier, SMA-Perioden, RSI-Level usw.). Nachfolgend sind optimierte Einstellungen für verschiedene Trading-Stile aufgeführt:
M1 (Scalping)
LookbackCandles: 20
ATRPeriod: 10
ATRMultiplier: 0.4
SMA Schnell/ Langsam: 10 / 30
RSI: 12 (Kauf > 55, Verkauf < 45) → Am besten für ultra-kurze Scalps mit schnellen Einstiegen.
M5 (Schnelles Intraday)
LookbackCandles: 25
ATRPeriod: 14
ATRMultiplier: 0.5
SMA Schnell/ Langsam: 20 / 50
RSI: 14 (Kauf > 55, Verkauf < 45) → Ausgewogen für kurze Intraday-Trades.
M15 (Intraday Swing)
LookbackCandles: 30
ATRPeriod: 14
ATRMultiplier: 0.6
SMA Schnell/ Langsam: 20 / 60
RSI: 14 (Kauf > 56, Verkauf < 44) → Ideal, um mittlere Intraday-Bewegungen zu erfassen.
H1 (Swing Trading)
LookbackCandles: 40
ATRPeriod: 20
ATRMultiplier: 0.7
SMA Schnell/ Langsam: 30 / 80
RSI: 14 (Kauf > 57, Verkauf < 43) → Stärkere Filter für höherstufige Swings.
H4 (Position Trading)
LookbackCandles: 50
ATRPeriod: 20
ATRMultiplier: 0.8
SMA Schnell/ Langsam: 50 / 100
RSI: 14 (Kauf > 58, Verkauf < 42) → Am besten für langfristige, hochzuverlässige Einstiege.
Warum Signal Strike wählen?
Signal Strike ist nicht nur ein weiterer Indikator – es ist ein Entscheidungswerkzeug, das Zeit spart, Unsicherheit reduziert und Tradern hilft, sich auf die besten Chancen zu konzentrieren. Egal, ob Sie ein Scalper auf M1 oder ein Swing-Trader auf H4 sind, Signal Strike passt sich Ihrem Stil an und liefert kraftvolle Einstiegssignale mit Klarheit und Präzision.
Übernehmen Sie die Kontrolle über Ihr Trading mit Signal Strike und erleben Sie den Unterschied, mit Vertrauen zu handeln.
Zusammenfassung
When a valid trade setup occurs, Signal Strike plots entry, stop loss, and take profit levels on the chart, each color-coded for clarity: blue for entry, orange for stop loss, and lime green for take profit. BUY signals are marked with green arrows and labels, while SELL signals use red. A confidence percentage accompanies each signal to indicate its strength. If no valid setup is detected, a “No valid BUY/SELL signal” message appears.
The indicator supports multiple timeframes from M1 to H4, with recommended settings optimized for scalping, intraday, swing, and position trading styles. Take profit and stop loss levels adjust dynamically based on volatility and RSI conditions. Signal Strike aims to assist traders in making informed decisions by highlighting clear entry points, risk levels, and profit targets across various markets including Forex, commodities, crypto, and stocks.
Kundenbewertungen
5 | 50 % | |
4 | 0 % | |
3 | 50 % | |
2 | 0 % | |
1 | 0 % |