present
ลงทะเบียนและรับส่วนลด $50 สำหรับการซื้อครั้งแรกของคุณ
Trading product for Volume Profile Fixed Range - Pro อินดิเคเตอร์ XAUUSD, image 1
Volume Profile Fixed Range - Pro
อินดิเคเตอร์
15 การซื้อ
เวอร์ชัน 3.0, Jul 2026
Windows, Mac
4.3
รีวิว: 3
Trading product for Volume Profile Fixed Range - Pro อินดิเคเตอร์ XAUUSD, image 2
Trading product for Volume Profile Fixed Range - Pro อินดิเคเตอร์ XAUUSD, image 3
Trading product for Volume Profile Fixed Range - Pro อินดิเคเตอร์ XAUUSD, image 4
ตั้งแต่ 09/04/2025
17
การขาย

คำอธิบาย

VOLUME PROFILE FIXED RANGE — PRO


ตัวบ่งชี้ส่วนใหญ่บอกคุณว่าราคาวิ่งไปที่ไหน Volume Profile บอกคุณว่าตลาดซื้อขายที่ไหนจริง ๆ — ระดับที่ผู้ซื้อและผู้ขายทำธุรกรรมปริมาณจริง ระดับเหล่านั้นยังคงทำหน้าที่เป็นแนวรับ แนวต้าน และแม่เหล็กราคาแม้หลังจากการเคลื่อนไหวสิ้นสุดลงแล้ว


ตัวบ่งชี้นี้นำเสนอ Volume Profile แบบครบถ้วนและมืออาชีพสู่ cTrader: เลือกช่วงใดก็ได้บนชาร์ตของคุณ หรือให้มันสร้างโปรไฟล์หนึ่งโปรไฟล์ต่อวันซื้อขายโดยอัตโนมัติ และดูโครงสร้างปริมาณ จุดควบคุม และพื้นที่มูลค่าทันที


🆕 สิ่งใหม่ในเวอร์ชัน 3


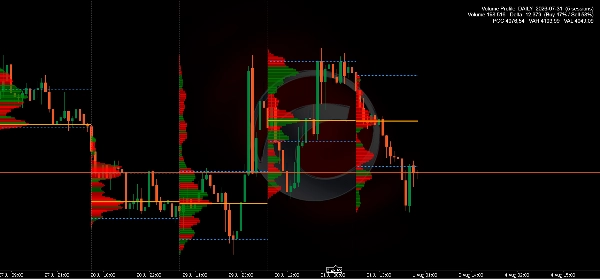
• โปรไฟล์รายวัน — ทุกวันซื้อขายจะมีโปรไฟล์ จุดควบคุม และพื้นที่มูลค่าของตัวเอง วาดภายในวันนั้นและสร้างโดยอัตโนมัติเมื่อคุณเลื่อนดู

• รวมช่วงเวลาสั้น ๆ — การเปิดตลาดวันอาทิตย์ที่บางและวันหยุดครึ่งวันจะถูกรวมเข้ากับวันซื้อขายถัดไปแทนที่จะทิ้งโปรไฟล์เล็ก ๆ ที่ไม่สมบูรณ์ไว้เบื้องหลัง

• ฮิสโตแกรมภายในช่วง — ตำแหน่งที่สามที่ยึดโปรไฟล์ไว้กับช่วงของมันเองแทนขอบชาร์ต เพื่อให้มันอยู่ในที่ที่ควรอยู่ขณะคุณเลื่อนดู

• ระดับที่อยู่ในช่วงของตัวเอง — POC, VAH และ VAL สามารถขยายได้เฉพาะช่วงเซสชันของตัวเองแทนทั้งชาร์ต ซึ่งช่วยให้โปรไฟล์หลายโปรไฟล์อ่านง่าย

• การแจ้งเตือนระดับ — การแจ้งเตือนทางเลือกเมื่อราคาสัมผัส POC, VAH หรือ VAL พร้อมช่วงเวลาคูลดาวน์เพื่อไม่ให้ระดับที่ถูกทดสอบส่งสแปมคุณ

• โปรไฟล์สด — ปริมาณของแท่งเทียนปัจจุบันถูกรวมในขณะที่มีการซื้อขาย ไม่ใช่แค่หลังจากแท่งปิด


📊 สิ่งที่แสดง


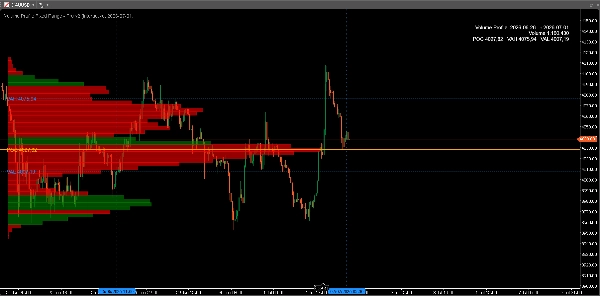
• POC (จุดควบคุม) — ระดับราคาที่มีปริมาณการซื้อขายสูงสุดในช่วง

• พื้นที่มูลค่า (VAH / VAL) — โซนที่มีปริมาณทั้งหมด 70% (ปรับได้ตั้งแต่ 50% ถึง 95%) คำนวณด้วยวิธีขยาย Market Profile มาตรฐานเพื่อให้ระดับของคุณตรงกับสิ่งที่มืออาชีพเห็นบนแพลตฟอร์มอื่น ๆ

• ฮิสโตแกรมปริมาณ — 10 ถึง 400 แถวราคา แต่ละแถวแบ่งเป็นปริมาณซื้อและขายเพื่อให้เห็นการดูดซับและความไม่สมดุลได้อย่างชัดเจน

• POC ที่พัฒนา — วิธีที่ราคาที่ยุติธรรมที่สุดพัฒนาไปตามช่วง (ตัวเลือก)

• ความแม่นยำระดับนาที — โปรไฟล์สร้างจากข้อมูล M1 แม้ในชาร์ต H1 หรือรายวัน แม่นยำกว่าการประมาณจากแท่งเทียน


🎯 วิธีที่เทรดเดอร์ใช้


• การตอบสนองการซื้อขายที่ POC — มักทำหน้าที่เป็นแนวรับ/แนวต้านที่แข็งแกร่งและแม่เหล็กดึงกลับสู่ค่าเฉลี่ย

• ใช้ขอบพื้นที่มูลค่าเพื่อกำหนดขอบเขตช่วงและสังเกตการเบรกเอาต์ที่แท้จริง

• เปรียบเทียบโปรไฟล์ที่พัฒนาของวันนี้กับของเมื่อวานเพื่อดูว่ามูลค่ากำลังเคลื่อนขึ้น ลง หรือคงที่

• ระบุโซนปริมาณต่ำที่ราคามักเคลื่อนที่เร็ว — เป้าหมายและพื้นที่หยุดตามธรรมชาติ

• ยืนยันระดับสำคัญของคุณด้วยการมีส่วนร่วมของตลาดจริงแทนแค่การเคลื่อนไหวของราคา


⚙️ ปรับแต่งได้เต็มที่


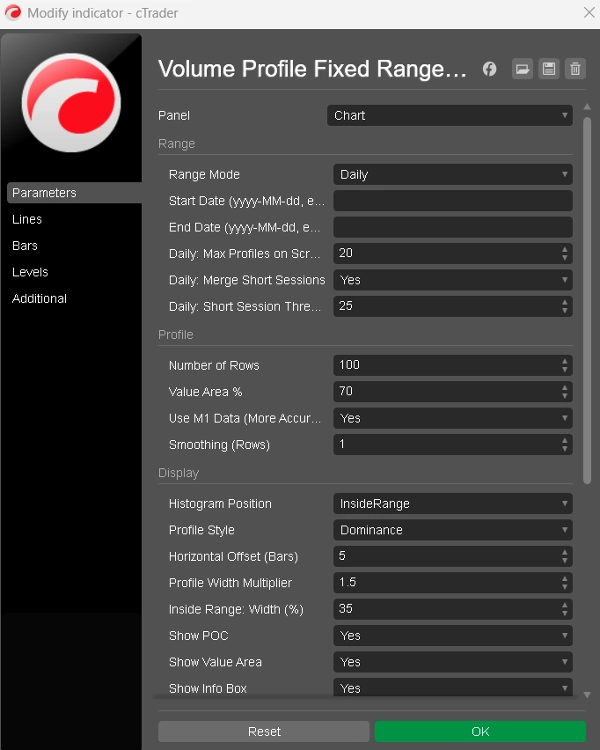
• โหมดช่วงสามแบบ: ลากสองเส้นบนชาร์ต, พิมพ์วันที่คงที่ หรือรายวัน

• ตำแหน่งฮิสโตแกรมสามตำแหน่ง: ขอบขวา, ขอบซ้าย หรือภายในช่วง

• แถว, เปอร์เซ็นต์พื้นที่มูลค่า, การปรับเรียบ, ความกว้าง, การเลื่อน และขอบแถว

• สไตล์ฮิสโตแกรมสองแบบ: แบ่งซื้อ/ขาย หรือสีเด่นเดียว

• สีทุกสีปรับแต่งได้; POC, พื้นที่มูลค่า, ตัวแบ่งวัน, แผงข้อมูล และ POC ที่พัฒนาแต่ละอย่างสามารถเปิดปิดได้ และแผงข้อมูลสามารถวางได้ทุกมุม


🔧 สร้างมาเพื่อการใช้งานรายวัน


• ใช้งานได้กับสัญลักษณ์และกรอบเวลาทุกประเภท

• ค่าเริ่มต้นที่สมเหตุสมผล — โปรไฟล์ที่ใช้งานได้จะปรากฏขึ้นภายในไม่กี่วินาทีหลังจากแนบ ไม่ต้องตั้งค่า

• ช่วงที่เลือกจะยังคงอยู่เมื่อเปลี่ยนกรอบเวลาและรีสตาร์ท

• ประวัติข้อมูลเก่าจะโหลดโดยอัตโนมัติเมื่อช่วงของคุณต้องการ และชาร์ตจะแจ้งเมื่อข้อมูลที่มีไม่ครอบคลุมคำขอ

• ลื่นไหลและมีประสิทธิภาพ: โปรไฟล์ติดตามการเลื่อนและซูมโดยไม่มีการกระพริบ และคำนวณใหม่เฉพาะเมื่อจำเป็น

• ซื้อครั้งเดียว ไม่มีการสมัครสมาชิก อัปเดตฟรี


ถ้าการวิเคราะห์ปริมาณเป็นส่วนหนึ่งของกระบวนการของคุณ — หรือคุณต้องการให้เป็น — นี่คือชุดเครื่องมือ Volume Profile ครบถ้วนที่สร้างขึ้นโดยตรงสำหรับ cTrader


สรุป

AI summary
Volume Profile Fixed Range - Pro is a professional volume profile indicator designed for the cTrader platform. It visualizes the distribution of traded volume within a user-defined price range, highlighting key market levels such as the Point of Control (POC)—the price with the highest traded volume—and the Value Area, which contains the majority of volume (typically 70%, adjustable between 50% and 95%). The indicator uses minute-level data for precise volume calculations, even on higher timeframe charts.

Users can interactively select the range by dragging lines on the chart or specify fixed start and end dates. The volume histogram displays buy and sell volume splits per price level, enabling identification of buying/selling pressure and volume imbalances. Additional features include a developing POC line showing how the fair price evolved within the range, adjustable smoothing for profile shape refinement, and a theme-aware design for readability on different chart backgrounds.

The indicator supports full customization of rows, histogram style, colors, and display elements. It automatically loads historical data as needed and recalculates only when the selected range changes, optimizing performance. It is suitable for any symbol and timeframe, providing traders with volume-based support and resistance levels, breakout zones, and areas of low volume that may indicate rapid price movement.
โปรไฟล์อินดิเคเตอร์
หมวดหมู่อินดิเคเตอร์
ปริมาณ
ประเภทเอาต์พุต
การแสดงเป็นภาพ
ข้อกำหนดด้านข้อมูล
แท่งเท่านั้น
ปริมาณ
ข้อมูล Tick
สัญญาณที่รองรับ
ความผันผวน
ความแข็งแกร่งของแนวโน้ม

รีวิวจากลูกค้า

4.3
รีวิว: 3
5
67 %
4
0 %
3
33 %
2
0 %
1
0 %
รีวิวจากลูกค้า
November 10, 2025
Solid option with care for volume based context. it adds useful information behind the price move, especially when used for checking participation, value areas and pressure. Volume context is stronger when POC, VWAP and value area agree across 2 sessions. The data helps most when price action confirms the same zone.
November 9, 2025
November 9, 2025
Helpful if controlled for a more controlled workflow. It helps with checking participation, value areas and pressure, but volume alone can be noisy without price action. Volume context is stronger when POC, VWAP and value area agree across 2 sessions. I would still keep manual review in the process.

การสนทนา

คำถามที่พบบ่อย

XAUUSD
ผลิตภัณฑ์ที่มีให้บริการผ่าน cTrader Store รวมถึงบอทการเทรด อินดิเคเตอร์ และปลั๊กอิน มีให้บริการโดยนักพัฒนาบุคคลที่สามและมีไว้เพื่อวัตถุประสงค์ในการเข้าถึงข้อมูลและทางเทคนิคเท่านั้น cTrader Store ไม่ใช่โบรกเกอร์และไม่ได้ให้คำแนะนำการลงทุน คำแนะนำส่วนบุคคล หรือการรับประกันผลการดำเนินงานในอนาคต

เพิ่มเติมจากผู้เขียนคนนี้

อินดิเคเตอร์
Volume
Imbalance
+2
FOOTPRINT PRO - Candles tell you where price moved

นอกจากนี้คุณยังอาจชอบ

อินดิเคเตอร์
ATR
EMA
+4
Range-filter BUY/SELL signals scored by four confluence layers, with a stop, five targets and a trend panel
อินดิเคเตอร์
Doji
Wedge
+5
Angora Pattern Recognition is a cTrader indicator that finds, draws and tracks classic chart patterns automatically.
อินดิเคเตอร์
Forex
BTCUSD
+6
All-In-One solution for ICT's FVG IFVG ORDERBLOCK in advanced mode.
อินดิเคเตอร์
ATR
MACD
+15
BrickAlgo TrendPulse is an advanced technical analysis tool that combines multiple indicators with filterin mechanisms.
"Supertrend-algo" โลโก้
ยอดนิยม
4.3
(3)
$19
/
$29
อินดิเคเตอร์
AI
ATR
+20
Algorithmic trend precision for cTrader.
อินดิเคเตอร์
Risk Dashboard
AI-powered daily range forecasts help traders spot volatility opportunities and plan stops and targets.
อินดิเคเตอร์
Area of Interest with the power of AI to detect the market interest.
อินดิเคเตอร์
RSI
VWAP
+3
Asia, London & NY sessions mapped in real time, boxes, VWAP, kill zones, range extensions, and a built-in RSI panel.
อินดิเคเตอร์
Supply & Demand
Support & Resistance
RAF Supply Demand Lite v1.0 automatically detects clean Supply and Demand zones using confirmed swing highs and lows. Zo
"Three Candle Patterns" โลโก้
ยอดนิยม
5.0
(2)
$19
/
$35
อินดิเคเตอร์
Forex
Crypto
+4
Spot powerful 3-candle reversal patterns like Morning/Evening Star and Soldiers/Crows at key swing highs and lows
อินดิเคเตอร์
RSI
Forex
+6
What Constance Brown did with the RSI was to input a momentum calculation within the RSI itself. This the Composite RSI.
"AlphaTrend Pro Max " โลโก้
เรตติ้งสูง
4.8
(5)
$19
/
$29
อินดิเคเตอร์
ATR
RSI
+17
Turn data into precision trades with AlphaTrend Pro Max — advanced trend, signal & structure analysis in one.
"Supertrend Indicator v1.1" โลโก้
ยอดนิยม
4.5
(4)
$19
/
$30
อินดิเคเตอร์
AI
ATR
+27
Supertrend Indicator
อินดิเคเตอร์
Forex
BTCUSD
+10
🎯Smart Signals : Auto Buy/Sell alerts with dynamic TP/SL algorithm. 💡
อินดิเคเตอร์
Prop
Forex
+4
Personal trade tracker for a single symbol. Clear net profit summary — FreshNet, ManageNet, DayNet, WTDNet, MTDNet.
อินดิเคเตอร์
ATR
Channel
Reversal Trap Probability Bands plots a dynamic volatility envelope around price & automatically detects "trap" reversal
อินดิเคเตอร์
ADX
ATR
+5
Range-filter BUY/SELL flips with an ATR or swing stop, three targets, five confluence stars and a live panel
อินดิเคเตอร์
Block Liquidity,indicator.Block Order, Liquids Stops, Signal Sentiment,signal correctio.

ราคา

ตั้งแต่ 09/04/2025
17
การขาย