
Sniper Zone Pro
Indicatore
2 acquisti
Versione 1.0, Jan 2026
Windows, Mac
4.6
Recensioni: 3
Descrizione
Indicatore Sniper Zone Pro
Il Sniper Zone Pro è uno strumento di analisi avanzato progettato per identificare visivamente l'impronta delle grandi istituzioni sul grafico dei prezzi. Combina la mappatura delle passate zone di indecisione con un sistema di colorazione delle candele che evidenzia i movimenti di manipolazione e la forza istituzionale. L'indicatore trasforma il caos del mercato in chiare regioni operative, permettendo ai trader di identificare esattamente dove il prezzo ha "combattuto" e dove tende a testare prima di una nuova espansione.
Caratteristiche principali dello Sniper Zone Pro
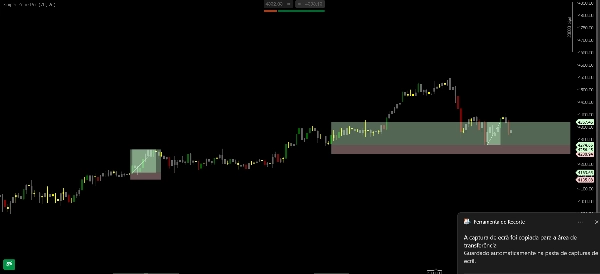
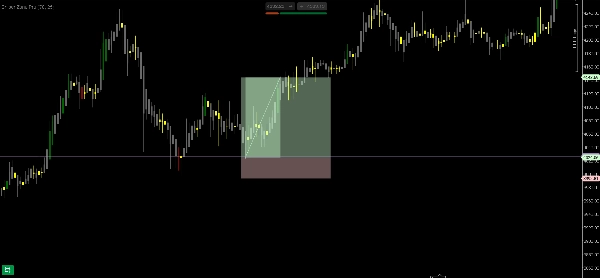
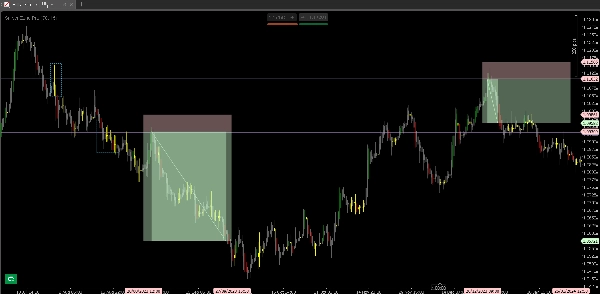
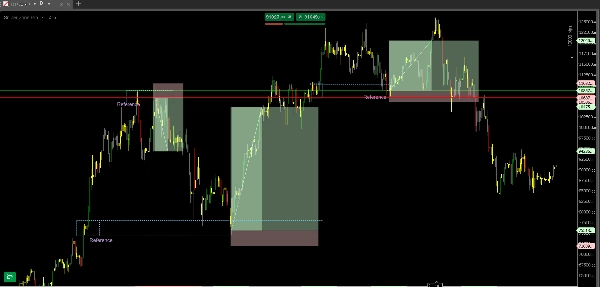
- Mappatura delle "Zone di Battaglia": Identifica automaticamente le aree di indecisione dove il prezzo ha accumulato volume. Queste regioni diventano cruciali "zone operative", poiché rappresentano livelli di prezzo con significative dispute tra acquirenti e venditori.
- Colorazione Istituzionale Attiva: Il sistema di colori non è solo estetico; evidenzia le candele con caratteristiche di movimento istituzionale (come alto volume o assorbimento), separando il rumore di mercato dalle intenzioni dei grandi operatori.
- Zone di Test ad Alta Probabilità: Al raggiungimento di una regione chiave, l'indicatore aiuta a visualizzare se il prezzo sta semplicemente testando la zona o è pronto a superarla, offrendo segnali di ingresso molto più precisi.
- Filtro di Gerarchia (HTF): Prioritizza le zone di interesse nei timeframe superiori, dove le battaglie di prezzo hanno maggiore rilevanza tecnica e il potenziale di ritorno è significativamente più alto.
Perché usare lo Sniper Zone Pro?
- Lettura dell'Intento di Mercato: Osservando i colori delle candele all'interno delle zone di battaglia, i trader possono identificare se le istituzioni stanno difendendo quella posizione o la stanno abbandonando.
- Definizione delle Zone Operative: Elimina il dubbio su "dove operare". L'indicatore mostra che le migliori opportunità non si trovano nel mezzo di un movimento, ma piuttosto nei test delle regioni dove il prezzo ha mostrato indecisione in precedenza.
- Riduzione della Soggettività: I trader smettono di cercare di "indovinare" massimi e minimi e iniziano a operare basandosi su aree di interesse professionale comprovate.
Riepilogo
Riepilogo AI
Sniper Zone Pro is an advanced trading indicator designed to visually identify institutional activity on price charts by mapping past indecision zones and applying a candle coloring system that highlights market manipulation and institutional strength. It automatically detects "battle zones" where price accumulated volume, marking key operational areas of buyer-seller disputes. The indicator’s color-coded candles reveal institutional movements such as high volume or absorption, helping traders distinguish significant market actions from noise. It also highlights high-probability test zones, indicating whether price is testing or ready to break through these critical levels. A hierarchy filter prioritizes zones from higher timeframes, emphasizing areas with greater technical relevance. Sniper Zone Pro supports multiple markets including Forex, cryptocurrencies, stocks, commodities, and indices, with tags referencing symbols like BTCUSD, EURUSD, GBPUSD, XAUUSD, NAS100, and USDJPY. The tool aids traders in reading market intent by showing institutional defense or abandonment of price levels, defining precise operating zones to reduce subjectivity, and focusing trading decisions on professional interest areas rather than arbitrary price points.
Profilo indicatore
Recensioni dei clienti
4.6
Recensioni: 3
5 | 67 % | |
4 | 33 % | |
3 | 0 % | |
2 | 0 % | |
1 | 0 % |
Recensioni dei clienti
January 19, 2026
The best part is random clicks become easier to catch, and a 1R exit plan makes review easier.
January 14, 2026
H1 makes the signal less noisy, and it adds a useful layer without forcing action.
January 5, 2026
No reason to yolo this live without a few normal sessions. The result needs a journal.
Discussioni
Domande frequenti
BTCUSD
Forex
Signal
Breakout
Indices
EURUSD
Commodities
GBPUSD
NZDUSD
Scalping
Crypto
Stocks
XAUUSD
NAS100
USDJPY
I prodotti disponibili tramite cTrader Store, inclusi bot di trading, indicatori e plugin, sono forniti da sviluppatori terzi e resi disponibili esclusivamente a scopo informativo e di accesso tecnico. cTrader Store non è un broker e non fornisce consulenze in materia di investimento, raccomandazioni individualizzate o garanzie di risultati futuri.


Prezzo
Da 11/07/2025
2
Vendite