
คำอธิบาย
หมายเหตุ: ทดสอบบน cTrader Windows เท่านั้น
LT_Ind_Pivot เป็นตัวบ่งชี้ Pivot Point ที่ทรงพลังและปรับแต่งได้สำหรับ cTrader ที่ช่วยให้เห็นภาพระดับตลาดหลักและโครงสร้างเซสชันในหลายกรอบเวลา
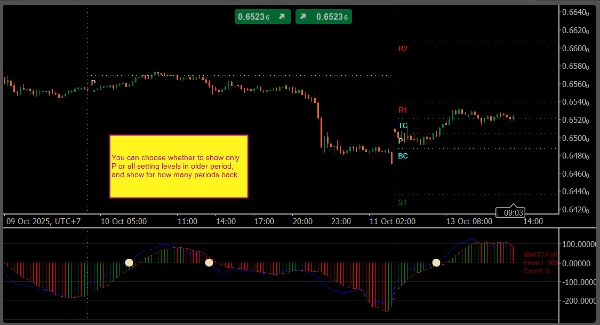
มันคำนวณและวาดโดยอัตโนมัติ Pivot (P), Support (S1–S5), Resistance (R1–R5), และ CPR (TC/BC) ตามระดับเวลาที่คุณเลือกเป็น Anchor timeframe — ตั้งแต่ H1, H4, H8, H12, D1, W1, ถึง Month1.
ตัวบ่งชี้ยังวาด เส้นแบ่งแนวตั้ง สำหรับแต่ละช่วงเวลา anchor ทั้งบน แผนภูมิหลัก และ แผงตัวบ่งชี้ ทำให้ง่ายต่อการแยกแยะขอบเขตเซสชันหรือช่วงเวลา
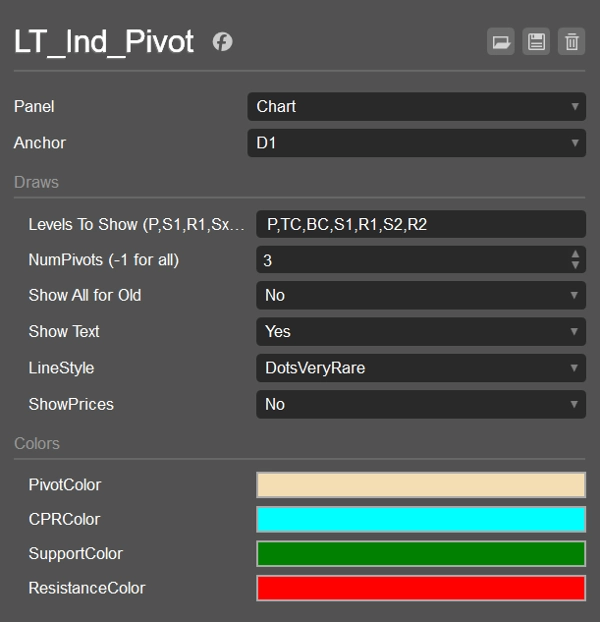
คุณสามารถกำหนดได้อย่างชัดเจนว่าจะให้แสดงระดับใดบ้างโดยใช้สัญลักษณ์ที่ยืดหยุ่น เช่น:
P, S1, R1– ระดับมาตรฐานPS1,S1S2,R1R2เป็นต้น – ระดับกลาง ระหว่าง pivots และ support/resistance หลักTC,BC– ช่วง Pivot กลาง (CPR)
การควบคุมการแสดงผลช่วยให้คุณตั้งค่าจำนวน pivot ในอดีตที่จะแสดงได้ว่าจะให้แสดงป้ายข้อความ/ราคา และวิธีการระบายสีหรือสไตล์แต่ละระดับ
คุณสมบัติหลัก
- จุดยึด Pivot: H1, H4, H8, H12, D1, W1, Month1
- ไวยากรณ์ระดับที่กำหนดเอง:
P, Sx, Rx, PS1, S1S2, R1R2, TC, BC - เส้นแบ่ง ช่วงเวลาแนวตั้ง บนแผนภูมิและแผงตัวบ่งชี้
- ตัวเลือกในการแสดงข้อความ ราคา และระดับ pivot เก่า
- การปรับแต่งสีและสไตล์เส้นอย่างเต็มที่
- น้ำหนักเบาและเหมาะสำหรับการเทรดสด
การตั้งค่าเริ่มต้น
- Anchor: D1
- แสดงระดับ:
P,S1,R1 - NumPivotsBack: 1
- ShowAllForOldPivots: false
- แสดงข้อความ: true
- แสดงราคา: false
- สไตล์เส้น: Solid
- สี: Pivot = Wheat, CPR = Cyan, Support = Green, Resistance = Red
กรณีการใช้งาน
- ทำเครื่องหมายโซน support/resistance ภายในวันและสวิง
- ติดตาม CPR และระดับกลาง สำหรับการตั้งค่าการเบรกเอาท์หรือการกลับตัวสู่ค่าเฉลี่ย
- ใช้ เส้นแบ่งช่วงเวลา เพื่อวิเคราะห์โครงสร้างแบบเซสชันต่อเซสชัน
- ผสมผสานกับตัวบ่งชี้ VWAP หรือ Swing เพื่อความสอดคล้องที่สูงขึ้น
สรุป
รีวิวจากลูกค้า
5 | 0 % | |
4 | 100 % | |
3 | 0 % | |
2 | 0 % | |
1 | 0 % |


