Penerangan
Signal Strike adalah penunjuk dagangan profesional yang direka untuk ctrader yang memberikan isyarat kemasukan yang jelas dan berkeyakinan tinggi terus pada carta anda. Dibina dengan logik canggih yang menggabungkan trend, momentum, volatiliti, dan pengesahan volum, alat ini membantu pedagang mengenal pasti peluang BELI dan JUAL yang tepat dengan keyakinan.
Tidak seperti penunjuk generik, Signal Strike direka untuk menapis lilin ketidaktentuan dan persediaan yang lemah. Apabila keadaan selari, penunjuk ini melukis tahap kemasukan, henti rugi, dan ambil untung terus pada carta, bersama dengan peratusan keyakinan. Jika tiada persediaan sah dikesan, penunjuk akan memaparkan “Tiada isyarat BELI/JUAL yang sah” di bahagian atas carta—jadi anda sentiasa tahu bila untuk bertindak dan bila untuk tidak masuk.
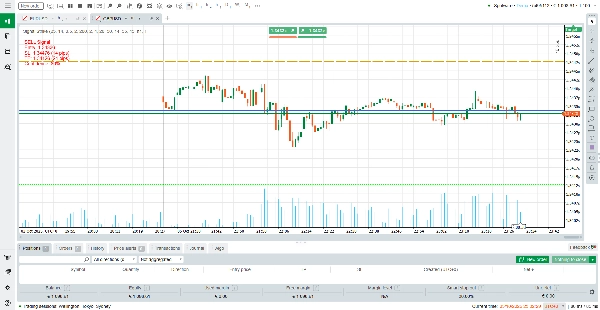
Dalam Signal Strike, setiap warna garis mempunyai makna yang jelas untuk membantu pedagang membaca carta dengan segera. Garis Kemasukan dilukis dengan warna biru, menandakan harga tepat di mana persediaan dagangan dicetuskan. Garis Henti Rugi muncul dalam warna oren, menunjukkan tahap perlindungan di mana dagangan akan ditutup jika pasaran bergerak bertentangan dengan anda.
Garis Ambil Untung dipaparkan dalam warna hijau limau, menonjolkan tahap sasaran di mana keuntungan dijamin. Untuk kejelasan arah, isyarat BELI ditekankan dalam warna hijau, manakala isyarat JUAL diserlahkan dalam warna merah. Warna yang kuat dan tepu ini memastikan setiap elemen menonjol, memudahkan untuk membezakan antara zon kemasukan, risiko, dan ganjaran dengan sekilas pandang.
Cara Membaca Isyarat
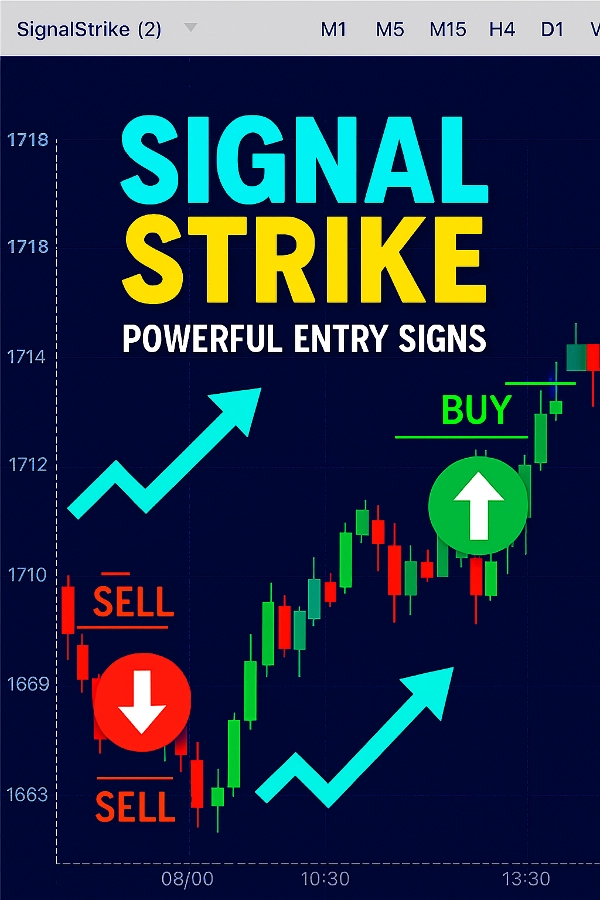
Isyarat BELI: Anak panah hijau ke atas dan label muncul, menunjukkan harga kemasukan, henti rugi, ambil untung, dan tahap keyakinan.
Isyarat JUAL: Anak panah merah ke bawah dan label muncul dengan butiran yang sama.
Tiada Isyarat: Jika keadaan pasaran tidak cukup kuat, penunjuk menulis “Tiada isyarat BELI/JUAL yang sah” di bahagian atas carta.
TP/SL Dinamik: Tahap ambil untung dan henti rugi disesuaikan secara automatik berdasarkan volatiliti dan keadaan RSI.
Untuk memaksimumkan hasil, disyorkan untuk bertukar antara jangka masa (M1, M5, M15, H1, H4) untuk mencari isyarat paling jelas mengikut gaya dagangan anda.
Cara Penunjuk Berfungsi
Signal Strike menggabungkan pelbagai lapisan analisis:
Pengesanan Trend.
Penapis Momentum.
Pemeriksaan Volatiliti.
Pengesahan Volum.
Penapis Ketidaktentuan – Lilin kecil dan lemah diabaikan untuk mengelakkan kemasukan palsu.
Hanya apabila keadaan ini selari, penunjuk menghasilkan isyarat BELI atau JUAL. Ini memastikan setiap isyarat disokong oleh pelbagai pengesahan, mengurangkan gangguan dan meningkatkan ketepatan.
Ciri Utama (5 Sorotan)
Tahap Kemasukan, SL, dan TP yang Jelas – Terlihat serta-merta pada carta.
Peratusan Keyakinan – Ketahui kekuatan setiap isyarat sebelum masuk.
Sokongan Pelbagai Jangka Masa – Berfungsi pada semua jangka masa dari M1 hingga H4.
Penapisan Automatik – Mengelakkan isyarat palsu semasa ketidaktentuan atau tempoh volum rendah.
Label Mesra Pengguna – Mudah dibaca, dengan “Tiada Isyarat” dipaparkan apabila keadaan tidak dipenuhi.
Tetapan Disyorkan Mengikut Jangka Masa
Penunjuk ini termasuk input fleksibel (LookbackCandles, ATRPeriod, ATRMultiplier, tempoh SMA, tahap RSI, dan lain-lain). Berikut adalah tetapan yang dioptimumkan untuk gaya dagangan yang berbeza:
M1 (Scalping)
LookbackCandles: 20
ATRPeriod: 10
ATRMultiplier: 0.4
SMA Fast/Slow: 10 / 30
RSI: 12 (Beli > 55, Jual < 45) → Terbaik untuk scalping ultra-pendek dengan kemasukan cepat.
M5 (Intraday Pantas)
LookbackCandles: 25
ATRPeriod: 14
ATRMultiplier: 0.5
SMA Fast/Slow: 20 / 50
RSI: 14 (Beli > 55, Jual < 45) → Seimbang untuk dagangan intraday pendek.
M15 (Ayunan Intraday)
LookbackCandles: 30
ATRPeriod: 14
ATRMultiplier: 0.6
SMA Fast/Slow: 20 / 60
RSI: 14 (Beli > 56, Jual < 44) → Sesuai untuk menangkap pergerakan intraday sederhana.
H1 (Dagangan Ayunan)
LookbackCandles: 40
ATRPeriod: 20
ATRMultiplier: 0.7
SMA Fast/Slow: 30 / 80
RSI: 14 (Beli > 57, Jual < 43) → Penapis lebih kuat untuk ayunan jangka masa lebih tinggi.
H4 (Dagangan Posisi)
LookbackCandles: 50
ATRPeriod: 20
ATRMultiplier: 0.8
SMA Fast/Slow: 50 / 100
RSI: 14 (Beli > 58, Jual < 42) → Terbaik untuk kemasukan jangka panjang dengan keyakinan tinggi.
Mengapa Memilih Signal Strike?
Signal Strike bukan sekadar penunjuk lain—ia adalah alat membuat keputusan yang menjimatkan masa, mengurangkan ketidakpastian, dan membantu pedagang menumpukan pada peluang terbaik. Sama ada anda seorang scalper di M1 atau pedagang ayunan di H4, Signal Strike menyesuaikan dengan gaya anda dan memberikan isyarat kemasukan yang kuat dengan kejelasan dan ketepatan.
Kawal dagangan anda dengan Signal Strike dan alami perbezaan berdagang dengan keyakinan.
Ringkasan
When a valid trade setup occurs, Signal Strike plots entry, stop loss, and take profit levels on the chart, each color-coded for clarity: blue for entry, orange for stop loss, and lime green for take profit. BUY signals are marked with green arrows and labels, while SELL signals use red. A confidence percentage accompanies each signal to indicate its strength. If no valid setup is detected, a “No valid BUY/SELL signal” message appears.
The indicator supports multiple timeframes from M1 to H4, with recommended settings optimized for scalping, intraday, swing, and position trading styles. Take profit and stop loss levels adjust dynamically based on volatility and RSI conditions. Signal Strike aims to assist traders in making informed decisions by highlighting clear entry points, risk levels, and profit targets across various markets including Forex, commodities, crypto, and stocks.
Ulasan pelanggan
5 | 50 % | |
4 | 0 % | |
3 | 50 % | |
2 | 0 % | |
1 | 0 % |