

Penerangan
Mereka yang terlibat dalam perdagangan tahu betapa pentingnya mengambil kira sesi sebelumnya.
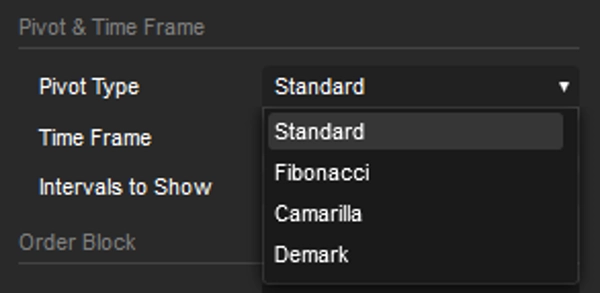
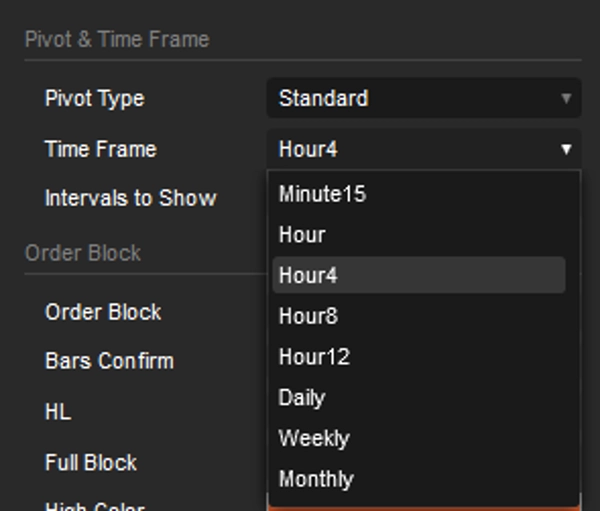
Saya telah menyediakan penunjuk Pivot ini, dengan selang masa dari 15 minit hingga sebulan, dan ia termasuk blok pesanan dan garis tren. Kedua-dua pilihan berdasarkan titik tertinggi dan terendah sesi sebelumnya.
Konfigurasi lalai ditetapkan untuk jangka masa 5 minit.
Pivot ditetapkan kepada 4 jam, dan selang masa adalah 5, yang bermaksud ia melihat kembali 20 jam dalam selang 4 jam. Ini sempurna untuk mereka yang berdagang harian.
Walau bagaimanapun, jika anda peminat Swing Trading, anda hanya perlu menukar selang Pivot; segala yang lain akan disesuaikan secara automatik.
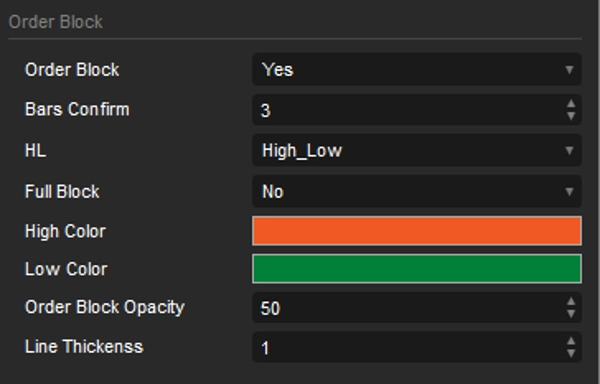
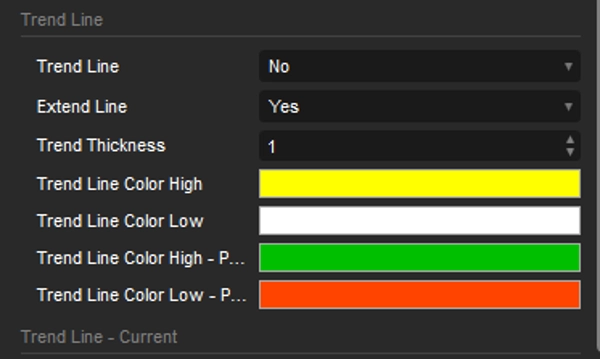
Blok pesanan menyerlahkan kawasan berpotensi di mana harga boleh menemui sokongan atau rintangan, menawarkan pandangan tentang kemungkinan pembalikan atau kesinambungan. Dengan menggabungkannya dengan garis tren yang dijana secara automatik untuk jangka masa yang dipilih, pedagang boleh mengenal pasti arah harga yang berpotensi dan titik masuk atau keluar yang mungkin dengan lebih tepat. Keupayaan untuk memvisualisasikan garis tren ini merentasi pelbagai jangka masa memberikan pemahaman yang lebih lengkap tentang struktur pasaran.
Dengan alat tambahan seperti
OrderPrice V3 https://ctrader.com/products/397
NTMPICLL https://ctrader.com/products/327
Range Box Level https://ctrader.com/products/245
Or RangeBoxFibonacci https://ctrader.com/products/526
Market Session https://ctrader.com/products/94
MacdVolume https://ctrader.com/products/267
4MA https://ctrader.com/products/247
Anda akan menjadi tidak terkalahkan
Semoga berjaya 😀
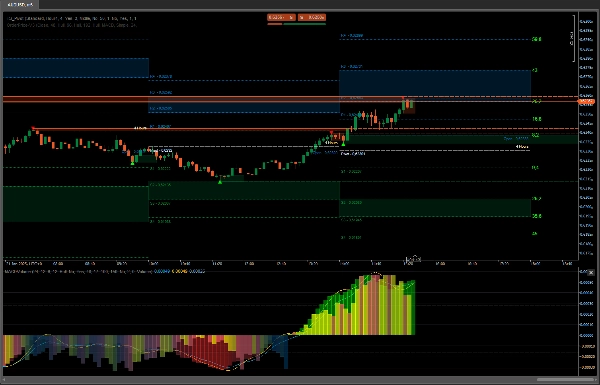
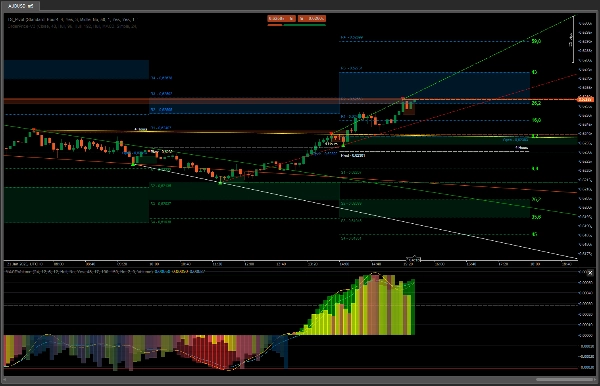
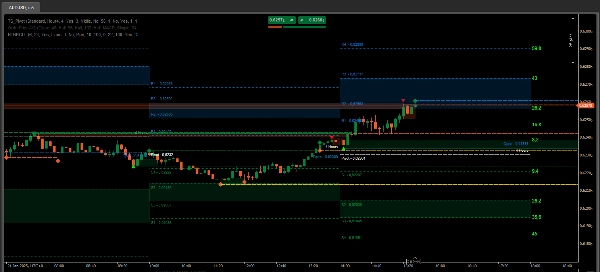
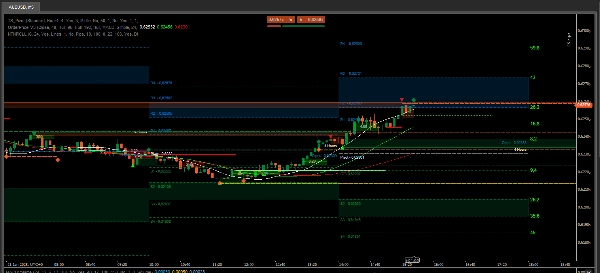
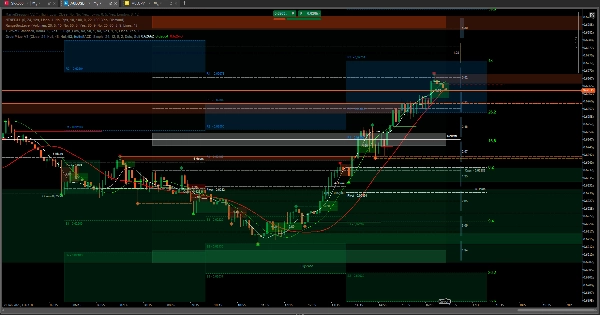
Dalam kes pembelian, dengan memerhatikan dua imej terakhir tingkah laku OrderPrice dan purata bergerak yang disertakan, apabila garis hijau muncul dan purata bergerak berada di bawah, itulah masa yang sempurna untuk membuka transaksi beli.
Dengan data dari sesi sebelumnya, anda boleh menentukan sejauh mana harga mungkin pergi atau di mana rintangan mungkin berlaku. Jika ia menembusi, ia mungkin meneruskan ke titik kedua, yang boleh menjadi zon neutral RangeBoxLevel. Jika ia melepasi itu dan tiada tanda bahawa purata bergerak mahu mengubah arah, harga boleh mencapai zon blok pesanan sesi sebelumnya.
Dalam imej terakhir, terdapat tangkapan skrin situasi sempurna untuk masuk dan keluar transaksi. Selebihnya hanyalah memerhati dan membuat kesimpulan.
Alat-alat ini penting apabila ia berkaitan dengan kemenangan melalui perdagangan aset.
Ringkasan
Key features include the integration of order blocks and trend lines derived from previous session data. Order blocks identify potential support and resistance zones, aiding in spotting possible price reversals or continuations. The indicator automatically generates trend lines for the selected timeframe, helping traders assess market structure and potential price direction. Visualizing these trend lines across multiple timeframes enhances market analysis.
TS_Pivot can be used alongside complementary tools such as OrderPrice V3, NTMPICLL, Range Box Level, RangeBoxFibonacci, Market Session, MacdVolume, and 4MA to refine entry and exit decisions. By combining moving averages and order block signals, traders can identify optimal moments to open buy or sell positions. The indicator supports various markets including Forex, cryptocurrencies, commodities, indices, and stocks.
Ulasan pelanggan
5 | 100 % | |
4 | 0 % | |
3 | 0 % | |
2 | 0 % | |
1 | 0 % |


