

present
Registrieren Sie sich und erhalten Sie $50 Rabatt auf Ihren ersten Kauf
Trading product for Weekly Opening Gaps Indikator Forex Indices, image 1
Weekly Opening Gaps
Indikator
2 käufe
Version 1.0, Mar 2026
Windows, Mac
4.3
Bewertungen: 3
Trading product for Weekly Opening Gaps Indikator Forex Indices, image 2
Trading product for Weekly Opening Gaps Indikator Forex Indices, image 3
Trading product for Weekly Opening Gaps Indikator Forex Indices, image 4
Trading product for Weekly Opening Gaps Indikator Forex Indices, image 5
Trading product for Weekly Opening Gaps Indikator Forex Indices, image 6
Trading product for Weekly Opening Gaps Indikator Forex Indices, image 7
Trading product for Weekly Opening Gaps Indikator Forex Indices, image 8
Trading product for Weekly Opening Gaps Indikator Forex Indices, image 9
29
Verkäufe
812
Kostenlose Installationen

Beschreibung

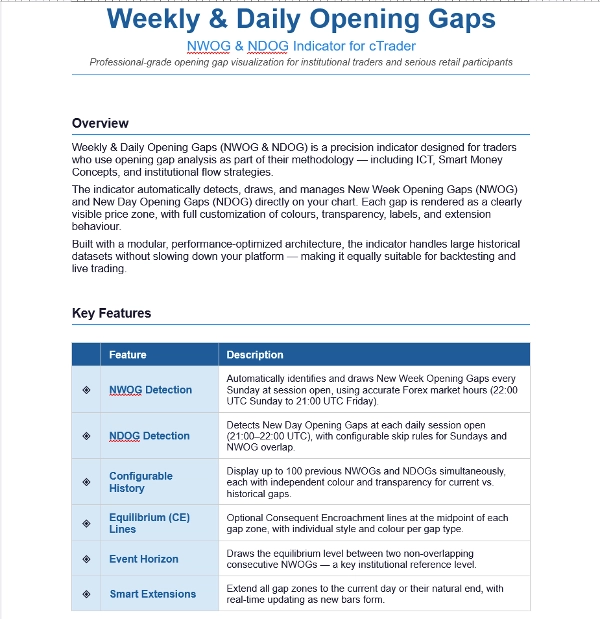
Wöchentliche & tägliche Eröffnungslücken — NWOG & NDOG Indikator

Professionelle Visualisierung von Eröffnungslücken für institutionelle Händler und ernsthafte Privatanleger


ÜBERSICHT

Wöchentliche & tägliche Eröffnungslücken (NWOG & NDOG) sind ein präziser Indikator, der für Händler entwickelt wurde, die die Analyse von Eröffnungslücken als Teil ihrer Methodik verwenden — einschließlich ICT, Smart Money Concepts und institutioneller Flow-Strategien.

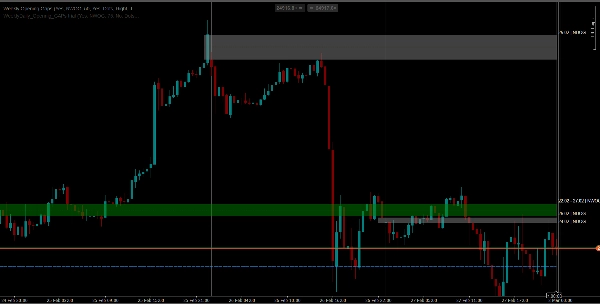
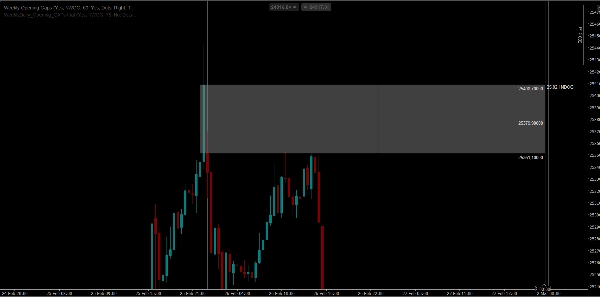
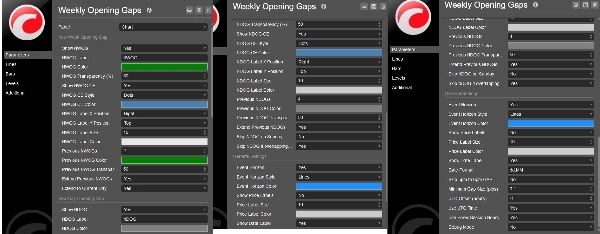
Der Indikator erkennt, zeichnet und verwaltet automatisch New Week Opening Gaps (NWOG) und New Day Opening Gaps (NDOG) direkt in Ihrem Chart. Jede Lücke wird als klar sichtbare Preiszone dargestellt, mit vollständiger Anpassung von Farben, Transparenz, Beschriftungen und Erweiterungsverhalten.

Mit einer modularen, leistungsoptimierten Architektur gebaut, verarbeitet der Indikator große historische Datensätze, ohne Ihre Plattform zu verlangsamen — was ihn gleichermaßen für Backtesting und Live-Trading geeignet macht.


HAUPTMERKMALE

◈ NWOG-Erkennung

◈ NDOG-Erkennung mit konfigurierbaren Überspringregeln für Sonntage und NWOG-Überlappungen.

◈ Konfigurierbare Historie — Anzeige von bis zu 100 vorherigen NWOG

◈ Gleichgewichtslinien (CE)

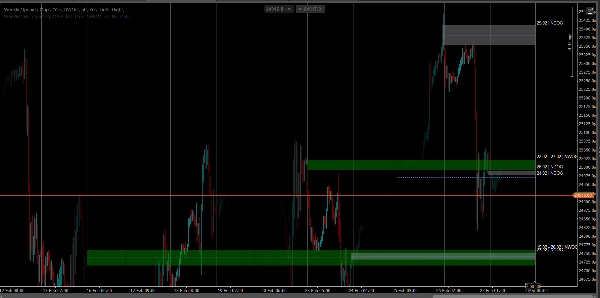
◈ Ereignishorizont — Zeichnet das Gleichgewichtsniveau zwischen zwei sich nicht überlappenden aufeinanderfolgenden NWOGs

◈ Intelligente Erweiterungen — Verlängert alle Lückenzonen bis zum aktuellen Tag oder deren natürlichem Ende, mit Echtzeit-Aktualisierung beim Entstehen neuer Bars.

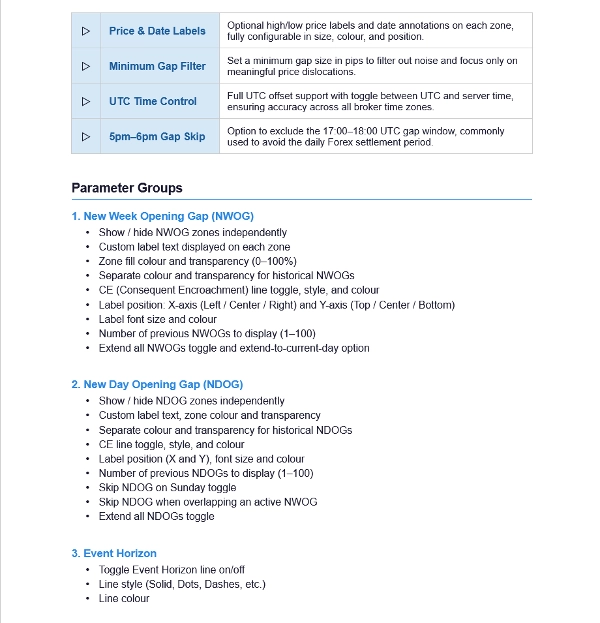
◈ Preis- & Datumsbeschriftungen

◈ Mindestlückenfilter

◈ UTC-Zeitsteuerung


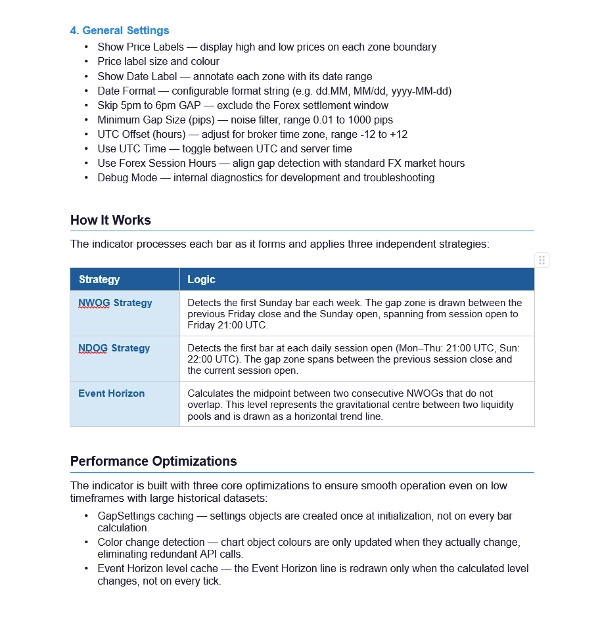
WIE ES FUNKTIONIERT

NWOG-Strategie — Erkennt die erste Sonntagskerze jeder Woche. Die Lückenzone wird zwischen dem Schlusskurs des vorherigen Freitags und der Eröffnung am Sonntag gezeichnet, und erstreckt sich von der Sitzungsöffnung bis Freitag 21:00 UTC.

NDOG-Strategie — Erkennt die erste Kerze jeder täglichen Sitzung (Mo–Do: 21:00 UTC, So: 22:00 UTC). Die Lückenzone erstreckt sich zwischen dem Schlusskurs der vorherigen Sitzung und der Eröffnung der aktuellen Sitzung.

Ereignishorizont — Berechnet den Mittelpunkt zwischen zwei aufeinanderfolgenden NWOGs, die sich nicht überlappen. Dieses Niveau repräsentiert das Gravitationszentrum zwischen zwei Liquiditätspools und wird als horizontale Trendlinie dargestellt.


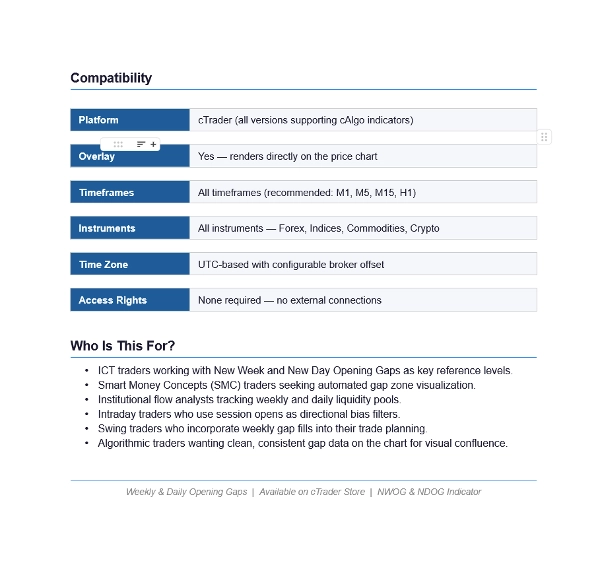
KOMPATIBILITÄT

Plattform: cTrader (alle Versionen, die cAlgo-Indikatoren unterstützen)

Overlay: Ja — wird direkt im Preischart dargestellt

Zeitrahmen: Alle Zeitrahmen (empfohlen: M1, M5, M15, H1)

Instrumente: Alle — Forex, Indizes, Rohstoffe, C


FÜR WEN IST DAS?

ICT-Händler, die mit New Week und New Day Opening Gaps als Schlüsselreferenzniveaus arbeiten

Smart Money Concepts (SMC) Händler, die eine automatisierte Visualisierung von Lückenzonen suchen

Institutionelle Flow-Analysten, die wöchentliche und tägliche Liquiditätspools verfolgen

Intraday-Händler, die Sitzungseröffnungen als Richtungsfilter verwenden

Swing-Trader, die wöchentliche Lückenfüllungen in ihre Handelsplanung einbeziehen

Algorithmische Händler, die saubere, konsistente Lückendaten im Chart für visuelle Übereinstimmung wünschen

Zusammenfassung

KI-Zusammenfassung
Weekly & Daily Opening Gaps (NWOG & NDOG) is a precision indicator for cTrader designed to automatically detect and visualize opening gaps on price charts. It identifies New Week Opening Gaps by marking the price zone between the previous Friday's close and the Sunday open, and New Day Opening Gaps by highlighting gaps between consecutive daily session closes and opens. The indicator supports full customization of colors, transparency, labels, and extension behavior, allowing users to tailor the display to their preferences.

Key features include configurable history to display up to 100 past weekly gaps, equilibrium lines representing midpoints between non-overlapping weekly gaps, and smart extensions that update gap zones in real time. It also offers filters for minimum gap size and UTC time control for session detection. The indicator is optimized for performance, handling large historical datasets efficiently for both backtesting and live trading.

Compatible with all instruments and timeframes on cTrader, it is suitable for Forex, Indices, Commodities, and more. This tool is aimed at traders employing institutional flow strategies, Smart Money Concepts, ICT methodologies, and those using session opens as directional bias or swing trading with gap fills. It overlays directly on price charts for clear visual reference.
Indikatorprofil

Kundenbewertungen

4.3
Bewertungen: 3
5
33 %
4
67 %
3
0 %
2
0 %
1
0 %
Kundenbewertungen
March 16, 2026
The small win here is market notes are quicker to compare, and the first week should show if it adds clarity.
March 9, 2026
A small account test feels safer, and chart checks feel less noisy.
March 4, 2026

Diskussion

Häufig gestellte Fragen (FAQ)

Forex
Indices
Commodities
SMC
AI
NAS100
Über den cTrader Store verfügbare Produkte, einschließlich Handelsbots, Indikatoren und Plugins, werden von externen Entwicklern bereitgestellt und nur zu Informations- und technischen Zugriffszwecken verfügbar gemacht. cTrader Store ist kein Broker und erbringt keine Anlageberatung, persönlichen Empfehlungen oder eine Garantie für zukünftige Performance.

Mehr von diesem Autor

Indikator
AI
Prop
+8
The EMA Trend Simple is a trend-following tool designed for simplicity and visual clarity.
cBot
Prop Firm Fit
Stop Loss (SL) Manager
+1
HTS Strategy Tester - Advanced Multi-Timeframe Trend & Pullback Trading System H1/m1 & H4/m5 WWS 33/144 Start from 100$
90.1%
Rendite
2.92
Gewinnfaktor
Indikator
AI
Grid
+7
Follow The Trend cBot - INDICATOR - displays two Moving Average Bands for cBot or for your own use
Indikator
AI
SMC
+7
The ultimate tool for Price Action and ICT. High, Low and Mid levels for days, weeks Inc. NY Midnight and Custom Range.
Indikator
ATR
Prop
+13
HCCC MTF (Hurst Cycle Composite Channel), Designed for Semi-Automated Trading, Interactive MTF Dashboard
Indikator
ATR
MACD
+15
MACD Advanced -- It combines the standard MACD logic with a rich set of visual tools
Indikator
Key Levels
TP_SL Very useful Risk & Reward Tool. Bring the ultimate TradingView-style Long/Short Position
Indikator
AI
RSI
+7
EMA MTF TREND PRO - Multi-timeframe trend analysis overlay indicator, 6 timeframes - in one table with ADX
Indikator
AI
Prop
+7
EMA Clouds, Multi-Timeframe (MTF) Overlay, Swing High/Low detection, and a smart Dashboard with neutral zone filtering.
Indikator
ATR
Channel
+1
Bollinger Bands Advanced Squeeze & Breakout System, Real-Time On-Chart Dashboard, Auto-Squeeze Detector, Dual-Band Cloud
„RSI Advanced“-Logo
Beste Ratings
5.0
(4)
$20
/
$30
Indikator
AI
ATR
+12
The standard Relative Strength Index (RSI), RSI & Signal Cloud, Smart Volatility Filter (ATR), On-Chart Info Dashboard
Indikator
SMC
Prop
+11
Sessions PRO is a professional session visualization indicator - 4 Fully Customizable Sessions

Das könnte Sie auch noch interessieren

Indikator
MACD
Forex
+2
a revolutionary indicator that integrates volume into MACD.
Indikator
XAUUSD
Commodities
A Fair Value Gap (FVG) indicator that identifies potential price imbalances, potential reversal and continuation zones
Indikator
SMC
Prop
+12
SMC Pro Suite: OBs, FVGs, Structure, Liquidity, Killzones & MTF overlay. Every concept in one cTrader indicator.
Indikator
Prop
Forex
+5
Pivot Point with base zone daily Asia-London-New york Session.
Indikator
VWAP
Volume
+2
VWAP Bands and Swing Wick Structure Indicator
Indikator
BOS
EMA
+5
Directional volume heatmap: see if a price zone was built on buying or selling, not just how much.
Indikator
CandleCounterAlex – Candle Cycle Counter with Colors and Adjustable Position.
Indikator
BOS
Volume
+5
20/40/60-day IPDA lookback ranges, Premium/Discount/Equilibrium zones, and quarterly shift alerts — anchored to true dai
Indikator
ATR
Prop
+6
🟢 Strength-ranked S/R zones with MTF levels and Pro labels. Nearest-zone band and HUD for faster, cleaner entries. 🔴
Indikator
Key Levels
Spots key hourly ranges and signals breakouts using arrows & colored background zones. Ideal for Gold.
Indikator
Volume
Channel
+5
Spots volatility squeezes before they fire — the compression phase everyone else misses.
Indikator
ATR
RSI
+8
Multi-timeframe market-state dashboard: Score (-100..+100) + UP/NEUT/DN per TF, with optional closed-candle arrows.
Indikator
RSI
Forex
+6
What Constance Brown did with the RSI was to input a momentum calculation within the RSI itself. This the Composite RSI.
Indikator
AI
ATR
+27
Supertrend Indicator
Indikator
ATR
Forex
+5
A powerful ATR-based indicator generating clear BUY/SELL signals. Features real-time alerts and customizable sensitivity
Indikator
Prop
VWAP
+15
VWAP: Follow the smart money. Trade with real volume and the fair price on your side!
Indikator
ATR
Key Levels
+5
CPR indicator that actually predicts the day ahead: width percentile scoring for breakout-day detection
Indikator
Forex
Crypto
+3
Detect powerful 2-candle reversal patterns at key highs/lows. Boost entries with real-time alerts and visual signals.

Preis

29
Verkäufe
812
Kostenlose Installationen




























