
Açıklama
📈 PineScriptLabs Akıllı Sinyaller CDRC [Otomatik TP/SL]
❓ Bu gösterge nedir?
Dinamik Kapanış Aralığı Kanalları (CDRC) sistemi PineScriptLabs teorisi kapsamında geliştirilmiş bir göstergedir ve iki bağımsız kanal kullanarak alım/satım sinyalleri 📊 üretir ve dinamik kar hedefleri (TP) ve zarar durdurma (SL) otomatik olarak hesaplar 🎯 ve bunlar asla aynı olmaz.
🎯 Özel Dinamik TP/SL Algoritması ⚡
Sabit seviyeler veya ATR kullanan sistemlerin aksine, bu algoritma TP ve SL'yi son sinyalden itibaren gerçek fiyat hareketine göre hesaplar:
• UZUN 📈 için: En düşük kaydedilen fiyat ile giriş arasındaki mesafeyi ölçer, bu hareketin yüzdesini hesaplar ve aynı yüzdeyi yukarı doğru projekte ederek hedefleri belirler
• KISA 📉 için: En yüksek kaydedilen fiyat ile giriş arasındaki mesafeyi ölçer ve bu yüzdeyi aşağı doğru projekte eder
🎯 Bu, her işlemin o anki piyasa bağlamına uyarlanmış benzersiz seviyelere sahip olduğu anlamına gelir ve sinyal öncesi gerçek momentumu yansıtır 💡
📊 CDRC Teorisi: Kanal İnşası 🏗️
Teknik Temel 🔍
CDRC teorisi kanalları yalnızca kapanış fiyat aralıklarına dayanarak oluşturur, volatilite veya standart sapmaya dayanmaz. Kapanışlar gerçek piyasa konsensüsünü temsil eder ve fitil gürültüsünü ortadan kaldırır 🎯
İnşaat Süreci ⚙️
- Ortalama Fiyat: Tüm dönem kapanışlarının ortalaması
- Aralık: Dönemin en yüksek ve en düşük kapanışı arasındaki fark
- Genlik: Aralık × Çarpan ÷ 2
- Bantlar:
o Üst = Ortalama Fiyat + Genlik ↗️
o Alt = Ortalama Fiyat - Genlik ↘️
🔄 Kanallar her bar üzerinde yeniden hesaplanır, piyasaya sürekli uyum sağlar
⚙️ Nasıl çalışır?
İki Eşzamanlı Kanal 📊📊
• Kanal 1 (Hızlı - 111 bar): Değişikliklere hızlı tepki verir, çarpan 0.14 ⚡
• Kanal 2 (Yavaş - 388 bar): Uzun vadeli görüş, çarpan 0.11 🐢
Sinyal Üretimi 🎯
• UZUN ✅: Fiyat, her iki kanalın üst bandının üzerinde 2 ardışık bar kapanışı yapar 🟢
• KISA ✅: Fiyat, her iki kanalın alt bandının altında 2 ardışık bar kapanışı yapar 🔴
🛡️ Çift onay yanlış sinyalleri filtreler
🤖 Otomatik TP/SL Hesaplama (Algoritma Detayı)
UZUN için 📈:
- Sistem, son sinyalden itibaren en düşük fiyatı sürekli kaydeder
- Alım sinyali oluşturulduğunda hesaplar: Yüzde = (Giriş - Minimum) / Giriş × 100
- Bu yüzdeyi yukarı doğru projekte eder TP3'ü belirlemek için girişten
- Aralığı üç bölgeye böler: TP1 (%33), TP2 (%66), TP3 (%100)
- SL = Giriş - (Giriş × Yüzde × Zarar Durdurma Oranı / 100)
KISA için 📉:
- Sistem, son sinyalden itibaren en yüksek fiyatı sürekli kaydeder
- Satış sinyali oluşturulduğunda hesaplar: Yüzde = (Maksimum - Giriş) / Giriş × 100
- Bu yüzdeyi aşağı doğru projekte eder TP3'ü belirlemek için girişten
- Aralığı üç ilerleyici bölgeye böler
- SL = Giriş + (Giriş × Yüzde × Zarar Durdurma Oranı / 100)
🎯 Sonuç: Her işlem, o anki piyasa momentumu doğrultusunda benzersiz seviyelere sahiptir.
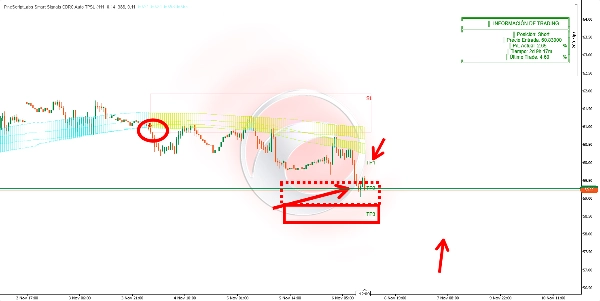
👀 Görselleştirme 🎨
• Noktalar: Her iki kanalın bantları
• Dinamik dolgu: Kanallar, geçildiğinde renk değiştirir
• Kutular: Giriş bölgesi (SL-Giriş) ve üç hedef bölgesi (ilerleyici şeffaflıklar)
• Etiketler: SL, TP1, TP2, TP3 tam fiyatlarla 🏷️
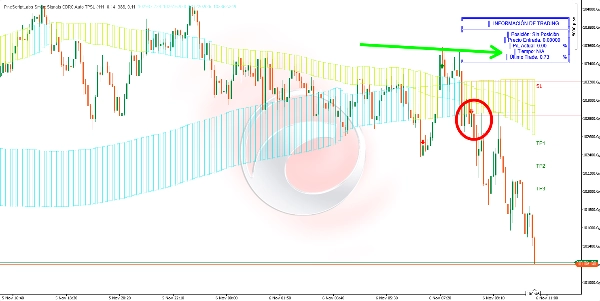
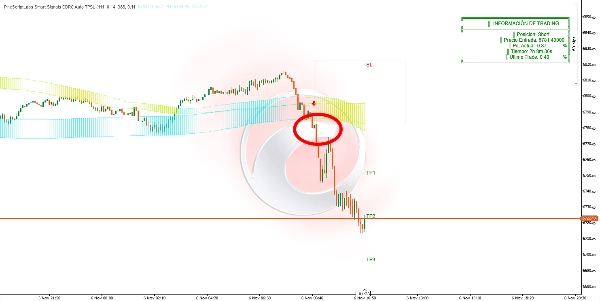
• Oklar: Yeşil (al) 🟢 / Kırmızı (sat) 🔴
• Tablo: Mevcut pozisyon, giriş fiyatı, mevcut K/Z %, işlem süresi, son kapanan işlem 📋
🎯 Ne için?
- Çift zaman dilimi onayı ile yüksek olasılıklı girişler ✅
- Gerçek piyasa hareketine dayalı uyarlanabilir otomatik risk yönetimi 🤖
- Her işlem için önceki momentuma göre benzersiz kademeli hedefler 🎯
- Son fiyat davranışına dinamik uyum 🔄
- Pozisyon performansının gerçek zamanlı izlenmesi 📊
🛠️ Nasıl kullanılır?
Giriş 🚀: Ok göründüğünde bar kapanışında girin
Yönetim 💼:
• TP1: Projeksiyon hareketinin %33'ü (kısmi karlar) 💰
• TP2: Hareketin %66'sı (daha fazla kar) 💰💰
• TP3: Hareketin %100'ü (nihai hedef) 🎯
• SL: Otomatik zarar durdurmayı her zaman saygı gösterin ⛔
İzleme 👀: Tablo mevcut K/Z'yi gerçek zamanlı gösterir. Sistem otomatik olarak TP3 veya SL'ye ulaşıldığında algılar. Aynı anda sadece bir aktif sinyal ⚠️
⚙️ Parametreler ve Etkileri
Kanal 1 Periyodu (111):
• ↑ Daha fazla bar = Daha az sinyal, daha güvenilir, daha yavaş 🐢
• ↓ Daha az bar = Daha fazla sinyal, daha hızlı, daha hassas ⚡
Kanal 1 Çarpanı (0.14):
• ↑ Daha yüksek = Geniş bantlar, daha az sinyal, sadece güçlü hareketler 💪
• ↓ Daha düşük = Dar bantlar, daha fazla sinyal, daha yüksek hassasiyet 🎯
Kanal 2 Periyodu (388):
• ↑ Daha yüksek = Katı onay, daha az sinyal 🛡️
• ↓ Daha düşük = Daha fazla sinyal, daha az filtreleme 📊
Kanal 2 Çarpanı (0.11):
• ↑ Daha yüksek = Katı filtreleme, muhafazakar 🎯
• ↓ Daha düşük = Daha yüksek hassasiyet, daha fazla işlem ⚡
Zarar Durdurma Oranı (%50):
• %50 = 1:2 oranı (profesyonel denge: risk 1, kar 2) ⚖️
• ↑ %100'e doğru = Geniş SL, daha fazla risk, daha az stop out, kötü R:R 📉
• ↓ %1'e doğru = Sıkı SL, daha az risk, daha iyi R:R, daha fazla stop out 📈
🔑 Önemli Hususlar
• Piyasa hafızası 🧠: Gerçekçi ve benzersiz projeksiyonlar için son sinyalden itibaren fiyat uçlarını kaydeder
• TP/SL asla eşit olmaz ⚖️: Her işlem kendi bağlamına göre hesaplanmış seviyelere sahiptir
• 2 ardışık bar için zorunlu çift onay ✅✅
• Aynı anda sadece bir aktif sinyal ⚠️
• Kanallar sürekli yeniden hesaplanır piyasaya uyum sağlar 🔄
• Kutular görsel olarak genişletilir görünürlüğü korumak için 👀
🚀 10.000+ trader zaten en iyi göstergelerimizi kullanıyor 🏆
👉 Tüm en iyi sistemlerimizi buradan alın:
_______________________________________________
📌 Piyasa Yapısı Göstergeleri
· ✅ AdvancedMarket Structure: Bos, Choch, SwinLevels, Order Blocks, Market Structure& Likidite Bulucu
· 🔄 Dynamic Market StructureAnalysis of Turning Points
· 🧱 Order Block
· ⚖️ Market Imbalance
· ⛓️ BOS & CHOCH
· 🧠 ICT Power of 3
_______________________________________________
🔚 Akıllı Çıkış Sistemleri
_______________________________________________
📐 ZigZag Göstergeleri
· 🔍 ZigZag Price LiquidityProjection
· ➖ ZigZag
_______________________________________________
🧱 Destek & Direnç Göstergeleri
· 🟩 SmartTrend Support &Resistance Lines
· 🧱 All Support and ResistanceLevels
_______________________________________________
📊 Trend & Kanal Göstergeleri
· 📊 Supertrend
_______________________________________________
💧 Hacim & Likidite Araçları
_______________________________________________
⚡ Momentum & RSI Göstergeleri
· 🔎 Multi-Level Candle Bias
Tracker
_______________________________________________
🔮 Tahmin & Projeksiyon Araçları
· 📐 Linreg & ATR'ye Dayalı Tahmin
· 📏 Fibonacci Lineer Regresyon Çoklu Zaman Dilimi
· 📈 Hacim Destekli Piyasa Akışı Projeksiyonu
Özet
Müşteri değerlendirmeleri
5 | 67 % | |
4 | 0 % | |
3 | 33 % | |
2 | 0 % | |
1 | 0 % |


