
PriceLevels
Indicateur
4 achats
Version 1.0, Jan 2025
Windows, Mac
5.0
Avis : 2
Description
Caractéristiques principales :
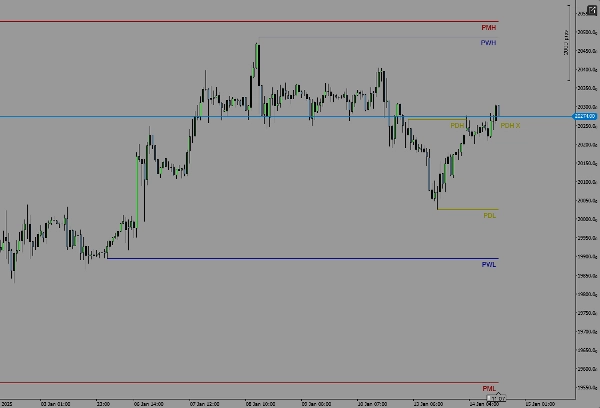
- Affiche les niveaux hauts et bas d'hier.
- Affiche les niveaux hauts et bas de la semaine dernière.
- Affiche les niveaux hauts et bas du mois dernier.
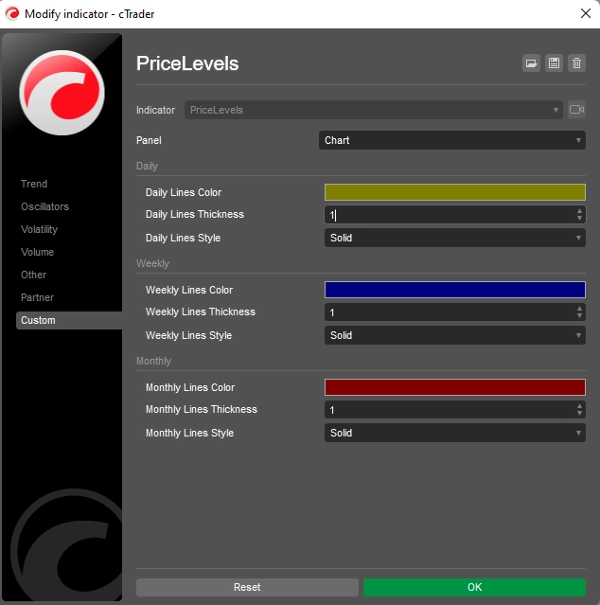
- Couleurs et styles de ligne personnalisables pour chaque niveau.
Comment ça fonctionne :
L'indicateur calcule automatiquement les prix les plus hauts et les plus bas pour la journée, la semaine et le mois précédents en fonction de la période de votre graphique. Ces niveaux sont ensuite tracés sous forme de lignes horizontales sur votre graphique, fournissant une référence visuelle claire de l'action des prix historique.
Compatibilité :
- Conçu uniquement pour la plateforme cTrader.
- Fonctionne sur toutes les périodes et tous les instruments.
Si vous avez des questions, des commentaires ou des suggestions d'amélioration, n'hésitez pas à nous contacter ! Votre avis est très apprécié et aidera à améliorer cet indicateur.
Bon trading !
Résumé
Résumé IA
PriceLevels is an indicator designed for the cTrader platform that automatically calculates and displays key historical price levels on trading charts. It plots the highest and lowest prices from the previous day, last week, and last month as horizontal lines, providing traders with clear visual references for past price action. The indicator supports all timeframes and instruments available on cTrader. Users can customize the colors and line styles for each displayed level to suit their charting preferences. This tool aids in identifying significant support and resistance zones based on recent historical data.
Profil de l'indicateur
Avis clients
5.0
Avis : 2
5 | 100 % | |
4 | 0 % | |
3 | 0 % | |
2 | 0 % | |
1 | 0 % |
Discussion
Questions fréquentes
Les produits disponibles sur cTrader Store, notamment les bots de trading, les indicateurs et les plug-ins, sont fournis par des développeurs tiers et mis à disposition à titre informatif et à des fins d'accès technique uniquement. cTrader Store n'est pas un courtier et ne fournit aucun conseil en investissement, aucune recommandation personnelle ni aucune garantie quant aux performances futures.


Prix
Depuis le 05/01/2025
14
Ventes