Descrizione
Cos'è un Indicatore di Trendline?
Un indicatore di trendline è uno strumento di analisi tecnica utilizzato da trader e analisti per identificare la direzione e la forza di un trend in un mercato finanziario. Si basa sul disegno di una linea retta che collega due o più punti di prezzo su un grafico. Lo scopo principale di una trendline è rappresentare visivamente la direzione generale del movimento del prezzo in un periodo specifico.
Indicatore di Trendline Multi Timeframe
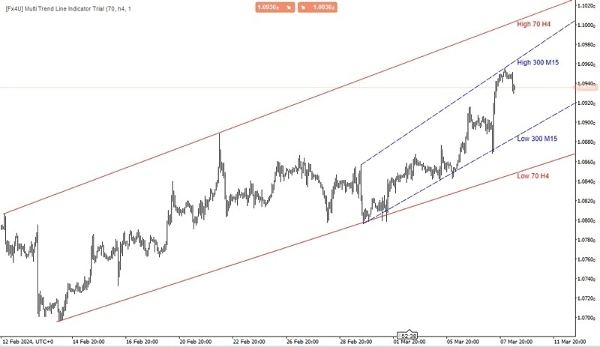
La funzione principale di un indicatore di trendline multi-timeframe è fornire ai trader una prospettiva più ampia delle tendenze di mercato aggregando informazioni da vari timeframe. Analizzando i trend su più timeframe, i trader possono prendere decisioni più informate sui potenziali punti di ingresso e uscita, così come sulla direzione generale del mercato.
Questo tipo di indicatore permette tipicamente ai trader di personalizzare i timeframe che vogliono analizzare e tracciare le trendline di conseguenza. Può essere uno strumento prezioso per identificare livelli chiave di supporto e resistenza, inversioni di trend e continuazioni di trend su diversi timeframe, aiutando così i trader a prendere decisioni di trading più accurate.
Esistono diversi tipi di trendline, tra cui:
- Trendline Ascendente: Questa viene tracciata collegando due o più minimi successivi su un grafico dei prezzi. Suggerisce un trend ascendente, indicando che i prezzi generalmente aumentano nel tempo.
- Trendline Discendente: Al contrario, una trendline discendente viene tracciata collegando due o più massimi successivi su un grafico dei prezzi. Suggerisce un trend discendente, indicando che i prezzi generalmente diminuiscono nel tempo.
- Trendline Orizzontale: Conosciute anche come linee di supporto o resistenza, queste sono tracciate orizzontalmente per indicare aree dove il movimento del prezzo tende a fermarsi o invertire.
I trader spesso usano le trendline in combinazione con altri indicatori tecnici e metodi di analisi per prendere decisioni di trading informate. Quando una trendline viene rotta o violata, può indicare un potenziale cambiamento nella direzione del trend, fornendo segnali di trading per gli investitori.
I miei altri prodotti:
https://ctrader.com/products/346
https://ctrader.com/products/336
https://ctrader.com/products/343
https://ctrader.com/products/347
https://ctrader.com/products/148
Riepilogo
This multi-timeframe indicator aggregates trend information across customizable timeframes, providing a comprehensive market overview. It supports the identification of upward, downward, and horizontal trendlines, which correspond to rising trends, falling trends, and support or resistance levels, respectively. By integrating trendlines from various timeframes, traders can better detect trend continuations, reversals, and key support/resistance zones.
The indicator assists in making informed trading decisions by highlighting potential entry and exit points based on trendline breaks or breaches. It is intended for use alongside other technical indicators and analysis methods to enhance market interpretation and trading accuracy.
Recensioni dei clienti
5 | 67 % | |
4 | 0 % | |
3 | 33 % | |
2 | 0 % | |
1 | 0 % |
![Logo di "[Fx4U] GBPUSD - Price Action"](https://cdn.ctrader.com/image/webp/d80b34fc-da3c-4f01-a321-456450665649_26190)

![Logo di "[Fx4U] CADJPY - Price Action"](https://cdn.ctrader.com/image/webp/1ba81247-b6b7-4f3c-a297-fa3eb1d57fe1_26195)

![Logo di "[Fx4U] AUDCHF - Price Action"](https://cdn.ctrader.com/image/webp/0a22e9aa-c83b-42cd-b0b8-c1a2da593207_26148)

![Logo di "[Fx4U] EURAUD - Price Action"](https://cdn.ctrader.com/image/webp/baf8dde4-1ef3-4beb-8ae2-0fed8320f65d_26177)