
Description
Signal Strike est un indicateur de trading professionnel conçu pour ctrader qui fournit des signaux d'entrée clairs et à haute confiance directement sur votre graphique. Construit avec une logique avancée combinant tendance, momentum, volatilité et confirmation de volume, cet outil aide les traders à identifier avec confiance des opportunités précises d'ACHAT et de VENTE.
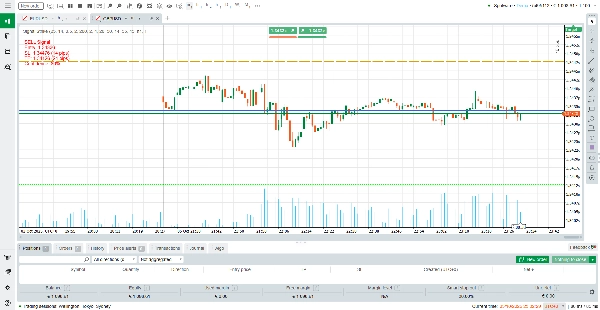
Contrairement aux indicateurs génériques, Signal Strike est conçu pour filtrer les chandeliers d'indécision et les configurations faibles. Lorsque les conditions sont réunies, l'indicateur trace les niveaux d'entrée, de stop loss et de take profit directement sur le graphique, ainsi qu'un pourcentage de confiance. Si aucune configuration valide n'est détectée, l'indicateur affichera « No valid BUY/SELL signal » en haut du graphique — vous savez donc toujours exactement quand agir et quand rester à l'écart.
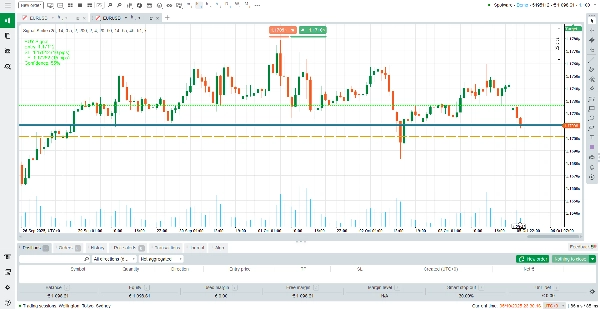
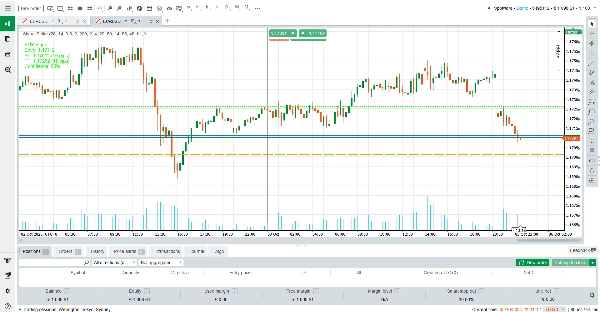
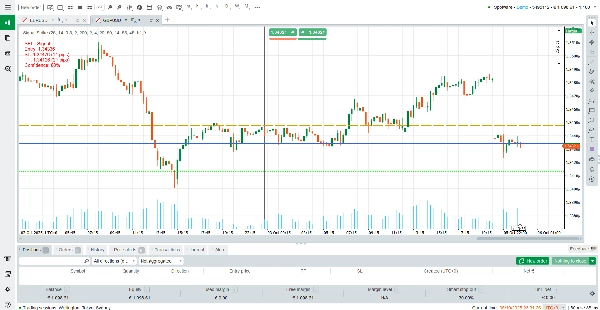
Dans Signal Strike, chaque couleur de ligne a une signification claire pour aider les traders à lire instantanément le graphique. La ligne d'entrée est tracée en bleu, marquant le prix exact où la configuration de trading est déclenchée. La ligne de stop loss apparaît en orange, indiquant le niveau protecteur où la position sera clôturée si le marché évolue contre vous.
La ligne de take profit est affichée en vert citron, mettant en évidence le niveau cible où les profits sont sécurisés. Pour plus de clarté directionnelle, les signaux d'ACHAT sont soulignés en vert, tandis que les signaux de VENTE sont mis en avant en rouge. Ces couleurs fortes et saturées garantissent que chaque élément se distingue, facilitant la distinction entre les zones d'entrée, de risque et de récompense d'un coup d'œil.
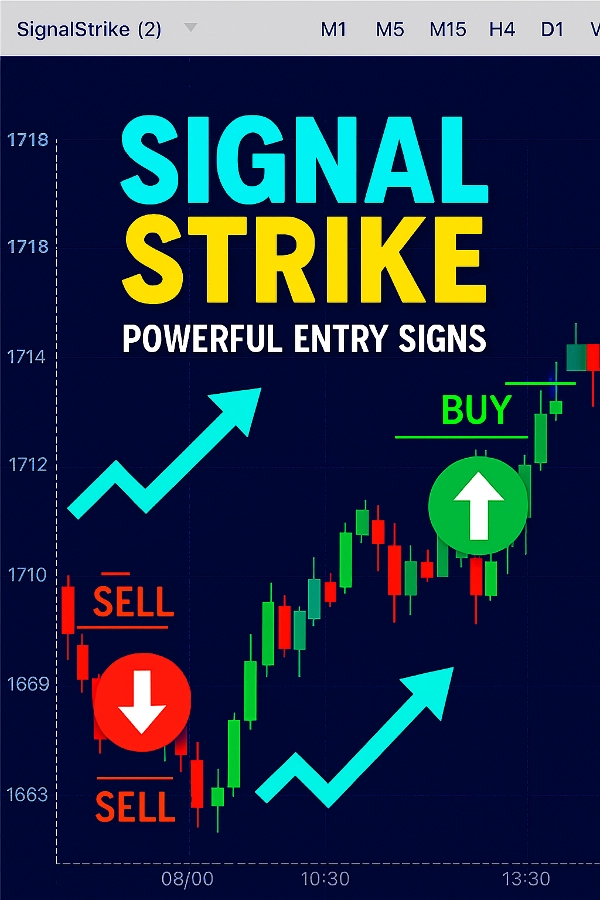
Comment lire les signaux
Signal d'ACHAT : Une flèche verte vers le haut et une étiquette apparaissent, indiquant le prix d'entrée, le stop loss, le take profit et le niveau de confiance.
Signal de VENTE : Une flèche rouge vers le bas et une étiquette apparaissent avec les mêmes détails.
Pas de signal : Si les conditions du marché ne sont pas suffisamment fortes, l'indicateur écrit « No valid BUY/SELL signal » en haut du graphique.
TP/SL dynamique : Les niveaux de take profit et de stop loss sont automatiquement ajustés en fonction de la volatilité et des conditions RSI.
Pour maximiser les résultats, il est recommandé de changer de timeframe (M1, M5, M15, H1, H4) pour trouver les signaux les plus clairs adaptés à votre style de trading.
Comment fonctionne l'indicateur
Signal Strike combine plusieurs couches d'analyse :
Détection de tendance.
Filtre de momentum.
Vérification de la volatilité.
Confirmation du volume.
Filtre d'indécision – Les petites chandelles faibles sont ignorées pour éviter les entrées fausses.
Ce n'est que lorsque ces conditions sont réunies que l'indicateur génère un signal d'ACHAT ou de VENTE. Cela garantit que chaque signal est soutenu par plusieurs confirmations, réduisant le bruit et améliorant la précision.
Caractéristiques clés (5 points forts)
Niveaux clairs d'entrée, SL et TP – Instantanément visibles sur le graphique.
Pourcentage de confiance – Connaissez la force de chaque signal avant d'entrer.
Support multi-timeframe – Fonctionne sur toutes les unités de temps de M1 à H4.
Filtrage automatique – Évite les faux signaux pendant les périodes d'indécision ou de faible volume.
Étiquettes conviviales – Faciles à lire, avec « No Signal » affiché lorsque les conditions ne sont pas remplies.
Paramètres recommandés par timeframe
L'indicateur inclut des entrées flexibles (LookbackCandles, ATRPeriod, ATRMultiplier, périodes SMA, niveaux RSI, etc.). Voici les réglages optimisés pour différents styles de trading :
M1 (Scalping)
LookbackCandles : 20
ATRPeriod : 10
ATRMultiplier : 0.4
SMA Fast/Slow : 10 / 30
RSI : 12 (Achat > 55, Vente < 45) → Idéal pour les scalps ultra-courts avec des entrées rapides.
M5 (Intraday rapide)
LookbackCandles : 25
ATRPeriod : 14
ATRMultiplier : 0.5
SMA Fast/Slow : 20 / 50
RSI : 14 (Achat > 55, Vente < 45) → Équilibré pour les trades intraday courts.
M15 (Swing intraday)
LookbackCandles : 30
ATRPeriod : 14
ATRMultiplier : 0.6
SMA Fast/Slow : 20 / 60
RSI : 14 (Achat > 56, Vente < 44) → Idéal pour capter les mouvements intraday moyens.
H1 (Swing trading)
LookbackCandles : 40
ATRPeriod : 20
ATRMultiplier : 0.7
SMA Fast/Slow : 30 / 80
RSI : 14 (Achat > 57, Vente < 43) → Filtres plus forts pour les swings sur des timeframes plus élevés.
H4 (Trading de position)
LookbackCandles : 50
ATRPeriod : 20
ATRMultiplier : 0.8
SMA Fast/Slow : 50 / 100
RSI : 14 (Achat > 58, Vente < 42) → Idéal pour des entrées à long terme avec une haute confiance.
Pourquoi choisir Signal Strike ?
Signal Strike n'est pas simplement un autre indicateur — c'est un outil d'aide à la décision qui fait gagner du temps, réduit l'incertitude et aide les traders à se concentrer sur les meilleures opportunités. Que vous soyez un scalpeur sur M1 ou un swing trader sur H4, Signal Strike s'adapte à votre style et fournit des signaux d'entrée puissants avec clarté et précision.
Prenez le contrôle de votre trading avec Signal Strike et découvrez la différence de trader avec confiance.
Résumé
Avis clients
5 | 50 % | |
4 | 0 % | |
3 | 50 % | |
2 | 0 % | |
1 | 0 % |


![Logo de "[Hamster-Coder] Pivot Points MTF"](https://cdn.ctrader.com/image/webp/4c143e5a-309c-40e3-a578-f04d1e133ffa_31159)


