

present
Inscrivez-vous et bénéficiez d'une remise de 50 $ sur votre premier achat
Trading product for MACD  -  advanced Indicateur BTCUSD Forex, image 1
MACD - advanced
Indicateur
5 achats
Version 1.0, Mar 2026
Windows, Mac
4.3
Avis : 6
Trading product for MACD  -  advanced Indicateur BTCUSD Forex, image 2
Trading product for MACD  -  advanced Indicateur BTCUSD Forex, image 3
Trading product for MACD  -  advanced Indicateur BTCUSD Forex, image 4
Trading product for MACD  -  advanced Indicateur BTCUSD Forex, image 5
Trading product for MACD  -  advanced Indicateur BTCUSD Forex, image 6
Trading product for MACD  -  advanced Indicateur BTCUSD Forex, image 7
Trading product for MACD  -  advanced Indicateur BTCUSD Forex, image 8
32
Ventes
957
Installations gratuites

Description

MACD Advanced — Description de l'indicateur

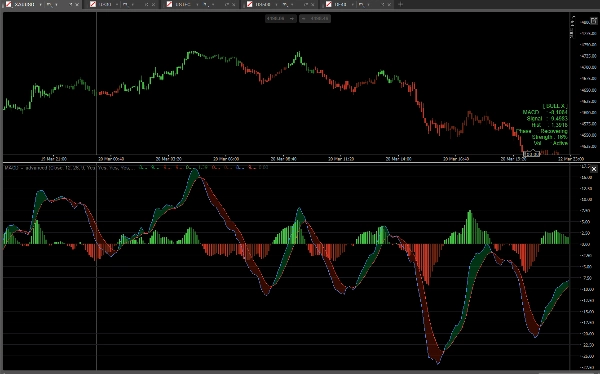
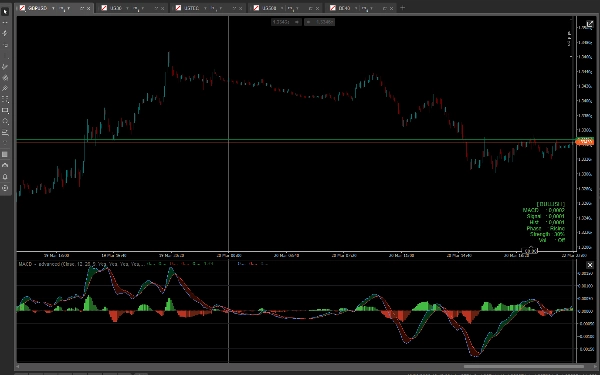
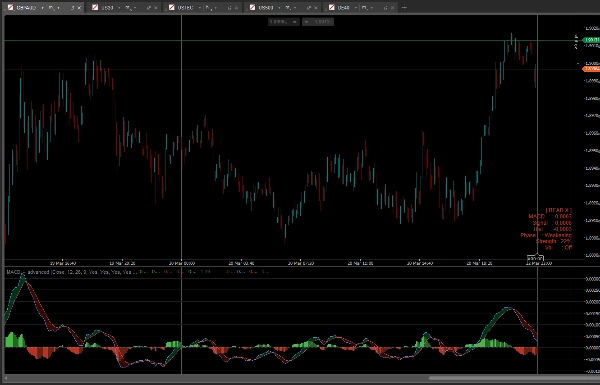
MACD Advanced est une amélioration professionnelle de l'indicateur MACD classique pour cTrader. Il combine la logique standard du MACD avec un ensemble riche d'outils visuels et de couches analytiques, offrant aux traders une vue beaucoup plus approfondie du momentum du marché, de la force de la tendance et des conditions de volatilité — le tout dans un seul panneau.


Histogramme avec coloration du momentum

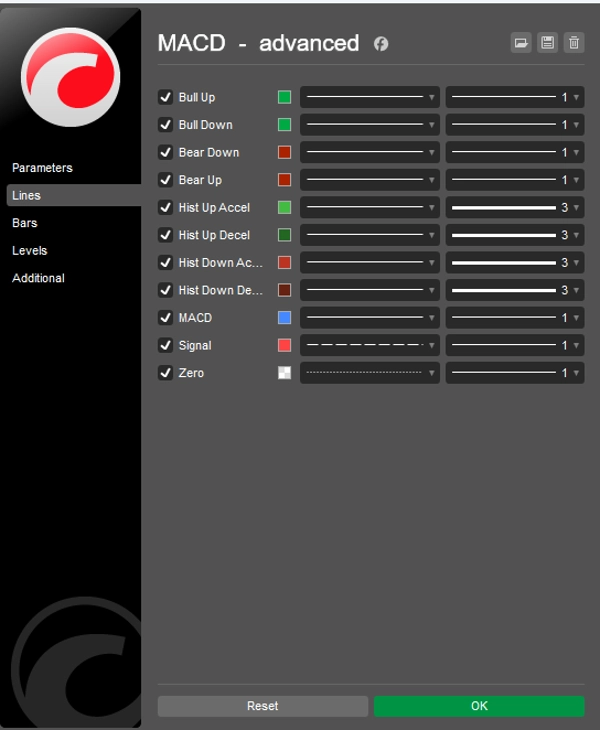
L'histogramme affiche la différence entre les lignes MACD et Signal et utilise quatre couleurs distinctes pour distinguer quatre états du marché : accélération haussière, décélération haussière, accélération baissière et décélération baissière. Cela permet de voir immédiatement si le momentum se construit ou s'affaiblit, sans aucun calcul manuel.


Nuage MACD

Un nuage optionnel remplit la zone entre les lignes MACD et Signal. Un nuage vert se forme lorsque le MACD est au-dessus du Signal (biais haussier), et un nuage rouge lorsque le MACD est en dessous du Signal (biais baissier). Le nuage offre une lecture visuelle instantanée de la direction de la tendance d'un seul coup d'œil.


Force de la tendance

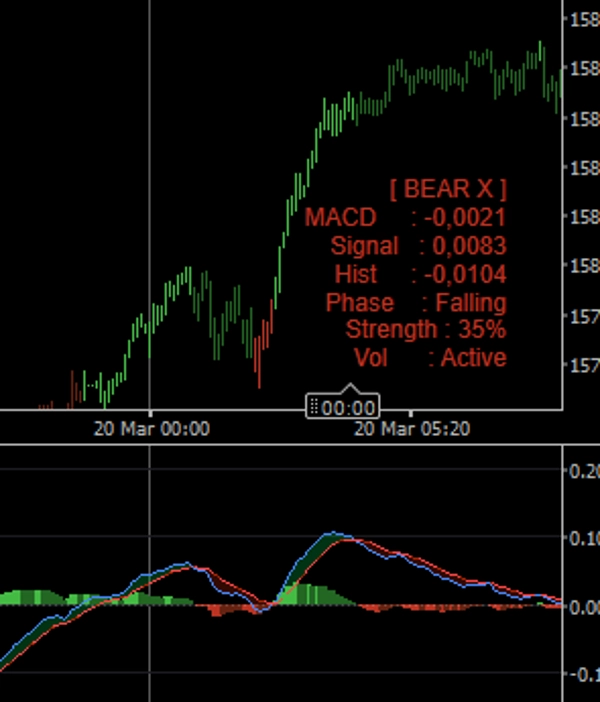
L'indicateur calcule un score de force de tendance en temps réel basé sur la séparation entre les lignes MACD et Signal sur une période de retour configurable. Le résultat est affiché en pourcentage dans le tableau d'information, vous aidant à évaluer la force ou la faiblesse du mouvement actuel.


Filtre de volatilité

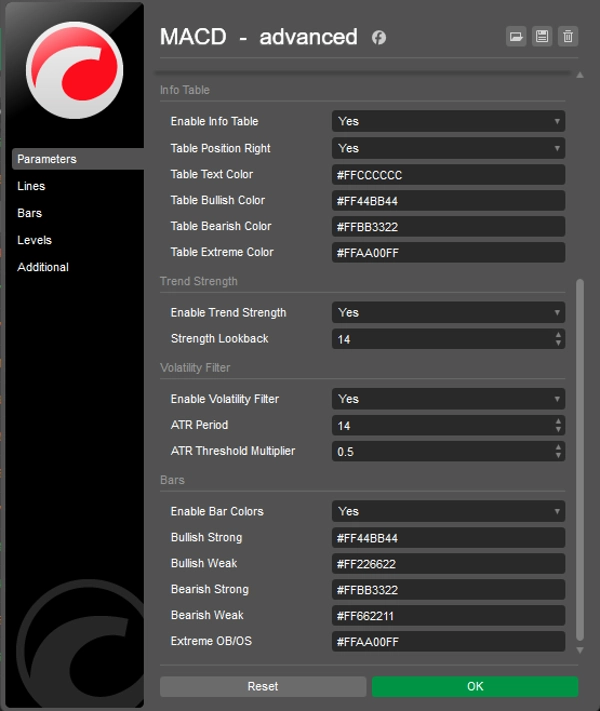
Un filtre de volatilité optionnel basé sur l'ATR supprime les signaux pendant les périodes de faible volatilité. Lorsqu'il est activé, les barres de l'histogramme et leurs couleurs passent à un gris neutre lorsque la volatilité descend en dessous d'un seuil configurable, évitant ainsi les fausses lectures dans les marchés calmes.


Tableau d'information

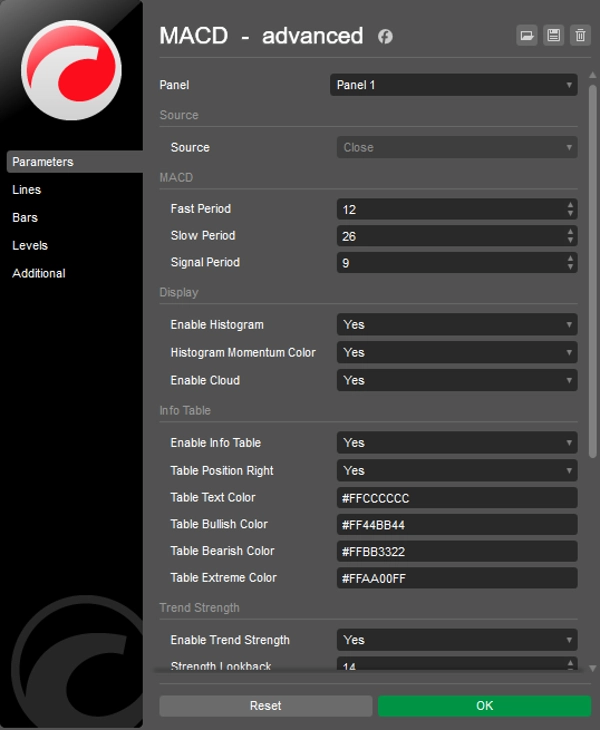
Un tableau compact affiché sur le graphique montre l'état actuel du marché (Haussier, Baissier, Croisement haussier, Croisement baissier, Neutre), les valeurs exactes du MACD et du Signal, la valeur de l'histogramme, la phase du cycle (Montante, Faiblissante, Récupération, Descendante), le pourcentage de force de la tendance et le statut du filtre de volatilité. La position du tableau (gauche ou droite) et toutes les couleurs sont entièrement configurables.


Coloration des barres

Lorsqu'elle est activée, l'indicateur recolore les chandeliers du graphique en fonction des conditions du MACD : haussier fort, haussier faible, baissier faible, baissier fort et faible volatilité. Cela apporte le signal MACD directement sur le graphique des prix sans changer de panneau.


Résumé des principales fonctionnalités

  • Histogramme de momentum à quatre couleurs
  • Nuage MACD entre les lignes MACD et Signal
  • Score de force de tendance en temps réel en pourcentage
  • Filtre de volatilité basé sur l'ATR avec retour visuel
  • Tableau d'information sur le graphique avec décomposition complète de l'état du marché
  • Coloration optionnelle des chandeliers basée sur les conditions MACD
  • Toutes les couleurs entièrement personnalisables avec support du canal alpha
  • Propre et léger — sans repeinture

Résumé

AI summary
MACD Advanced is a professional indicator for cTrader that enhances the classic MACD by integrating multiple visual and analytical tools into a single panel. It provides a detailed view of market momentum, trend strength, and volatility. Key features include a four-color momentum histogram that distinguishes between bullish and bearish acceleration or deceleration, and an optional MACD cloud that visually indicates trend direction by shading the area between the MACD and Signal lines in green or red. The indicator calculates a real-time trend strength score as a percentage based on the MACD and Signal line separation over a configurable period. An optional ATR-based volatility filter suppresses signals during low-volatility phases by changing histogram colors to neutral grey, reducing false signals. A compact on-chart info table displays current market state, MACD and Signal values, histogram data, cycle phase, trend strength, and volatility filter status, with customizable position and colors. Additionally, candle bars can be recolored based on MACD conditions to reflect strong or weak bullish/bearish trends and low volatility directly on the price chart. All colors support alpha channel customization. The indicator is designed to be clean, lightweight, and free from repainting. It supports various markets including Forex, indices, commodities, stocks, and cryptocurrencies.
Profil de l'indicateur

Avis clients

4.3
Avis : 6
5
33 %
4
67 %
3
0 %
2
0 %
1
0 %
Avis clients
April 6, 2026
April 4, 2026
April 1, 2026
the best part is the process slows down in a good way, and a 1R exit plan makes review easier.
March 28, 2026
Helps more when the trader avoids forced trades. Account protection still comes first.
March 27, 2026
Solid enough as a backup opinion. It is just a support layer.
March 25, 2026
Fine for a side read, especially when the chart is not clean. It can add noise if overused.

Discussion

Questions fréquentes

BTCUSD
Forex
Signal
Indices
EURUSD
Commodities
GBPUSD
NZDUSD
Prop
Scalping
Crypto
Stocks
XAUUSD
NAS100
ATR
MACD
USDJPY
Les produits disponibles sur cTrader Store, notamment les bots de trading, les indicateurs et les plug-ins, sont fournis par des développeurs tiers et mis à disposition à titre informatif et à des fins d'accès technique uniquement. cTrader Store n'est pas un courtier et ne fournit aucun conseil en investissement, aucune recommandation personnelle ni aucune garantie quant aux performances futures.

Plus de cet auteur

Indicateur
AI
Prop
+8
The EMA Trend Simple is a trend-following tool designed for simplicity and visual clarity.
cBot
Prop Firm Fit
Stop Loss (SL) Manager
+1
HTS Strategy Tester - Advanced Multi-Timeframe Trend & Pullback Trading System H1/m1 & H4/m5 WWS 33/144 Start from 100$
90.1%
ROI
2.92
Facteur de profit
Indicateur
AI
Grid
+7
Follow The Trend cBot - INDICATOR - displays two Moving Average Bands for cBot or for your own use
Indicateur
AI
SMC
+7
The ultimate tool for Price Action and ICT. High, Low and Mid levels for days, weeks Inc. NY Midnight and Custom Range.
Indicateur
ATR
Prop
+13
HCCC MTF (Hurst Cycle Composite Channel), Designed for Semi-Automated Trading, Interactive MTF Dashboard
Indicateur
AI
RSI
+7
EMA MTF TREND PRO - Multi-timeframe trend analysis overlay indicator, 6 timeframes - in one table with ADX
Indicateur
Key Levels
TP_SL Very useful Risk & Reward Tool. Bring the ultimate TradingView-style Long/Short Position
Indicateur
AI
SMC
+4
Weekly Daily Opening Gaps — NWOG & NDOG Indicator Professional-grade opening gap visualization for institutional traders
Indicateur
AI
Prop
+7
EMA Clouds, Multi-Timeframe (MTF) Overlay, Swing High/Low detection, and a smart Dashboard with neutral zone filtering.
Indicateur
ATR
Channel
+1
Bollinger Bands Advanced Squeeze & Breakout System, Real-Time On-Chart Dashboard, Auto-Squeeze Detector, Dual-Band Cloud
Logo de "RSI Advanced"
Les mieux notés
5.0
(4)
$20
/
$30
Indicateur
AI
ATR
+12
The standard Relative Strength Index (RSI), RSI & Signal Cloud, Smart Volatility Filter (ATR), On-Chart Info Dashboard
Indicateur
SMC
Prop
+11
Sessions PRO is a professional session visualization indicator - 4 Fully Customizable Sessions

Vous pourriez aussi aimer

Indicateur
Volume
Order Block
+1
Elevate your market analysis with the Aggression Delta Volume Profile, a premium, institutional-grade order flow utility
Indicateur
Prop
Forex
+4
Universal multi time frame 'Moving Average' indicator with extended features
Logo de "ORB v1"
Populaire
5.0
(3)
$19
Indicateur
Breakout
Opening Range Breakout (ORB) - Visual Edition
Indicateur
RSI
EURUSD
+2
It identifies areas of market imbalance (Fair Value Gaps or FVGs) and projects them on the chart in a smart way
Indicateur
BOS
MSS
+5
Your entire ICT session map, structure engine, and key levels — No manual work. One indicator. Every session!
Indicateur
AI
ATR
+27
🔮 Smart Bar Predictor - Professional Volatility Forecasting Indicator
Indicateur
Boost your trading with Candlestick Patterns for cTrader – auto-detect key signals for smarter, faster decisions!
Indicateur
VWAP
Volume
+5
Multi VWAP. Three timeframes. One clean chart. Your Essential Trading Tool.
Indicateur
Volume
Custom range volume profile between two draggable anchors. Auto source timeframe, Total/Up-Down/Delta, POC, Value Area.
Indicateur
ADX
ATR
+5
Precision Sniper by PrimeQuant: Advanced confluence engine with auto-presets, dynamic TP/SL, and live backtest stats.
Logo de "Swing Points"
Les mieux notés
4.5
(6)
$19
Indicateur
AI
SMC
+15
Multi-Timeframe Swing Points Indicator for cTrader that identifies swing highs and lows on both the current timeframe.
Indicateur
MACD
Key Levels
+2
Trend indicator with multi-timeframe filters, generating signals only on fully completed bricks & candles. No Repaint.
Indicateur
Allow trader to draw multi trendlines in different timeframes on one chart,Give trader an overview of the current market
Indicateur
Prop
Forex
+13
🎯Automatically detects and visualizes classical chart patterns using multi-timeframe swing point analysis.
Indicateur
Smart Liquidity Zones PRO auto-detects liquidity grabs, wicks, traps & manipulations — trade like the smart money.
Indicateur
ATR
RSI
+4
Adaptive Ichimoku with nine-factor confluence scoring, five signal types, smart TP/SL and an MTF panel.
Indicateur
Volume
Key Levels
+5
Volume Profile Pro - A Lightweight and Highly Customizable Side & Range Volume Profile
Indicateur
Overlay HTF context on any chart: color bars by HTF and draw filled HTF bodies with optional High/Low lines.

Prix

32
Ventes
957
Installations gratuites



























