Description
Ultimate Trend ADX est une version puissante et raffinée de l'indice directionnel moyen classique (ADX), conçue pour offrir aux traders une vue plus claire et plus dynamique des tendances et du momentum du marché. Contrairement à l'ADX standard, cet outil amélioré applique des techniques de lissage avancées (EMA ou KAMA) et introduit des options de mise à l'échelle pour rendre les lignes de l'indicateur plus réactives et visuellement impactantes. Le résultat est un indicateur de qualité professionnelle qui vous aide à identifier les tendances fortes, repérer les retournements et confirmer les entrées avec une plus grande confiance.
Comment lire l'indicateur
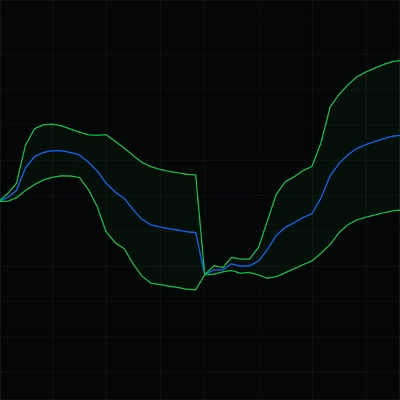
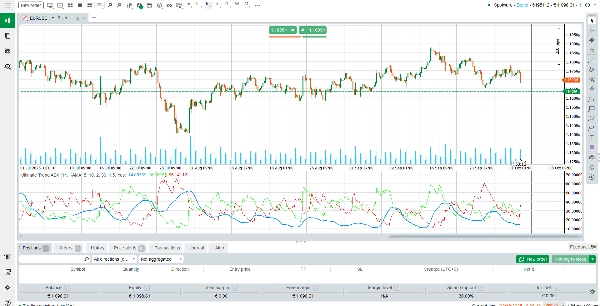
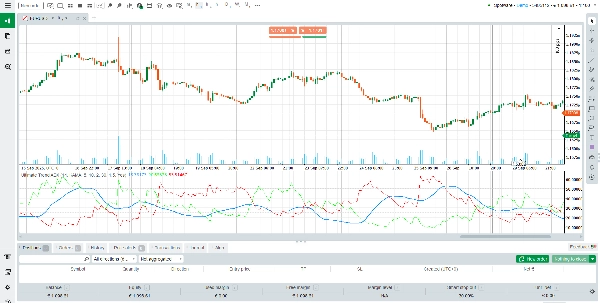
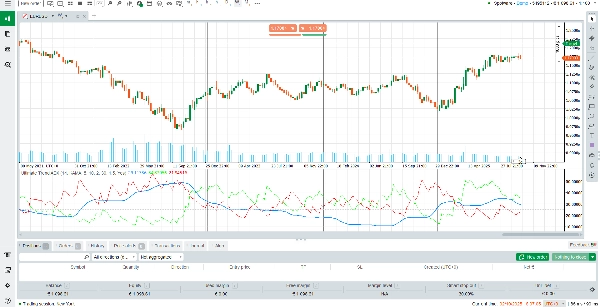
Ultimate Trend ADX affiche trois lignes clés dans une fenêtre séparée sous votre graphique :
Ligne ADX (Bleu/Jaune) : Mesure la force globale de la tendance. Un ADX en hausse indique une tendance qui se renforce, tandis qu'un ADX en baisse suggère un affaiblissement du momentum. Des valeurs supérieures à 25 signalent généralement une tendance forte.
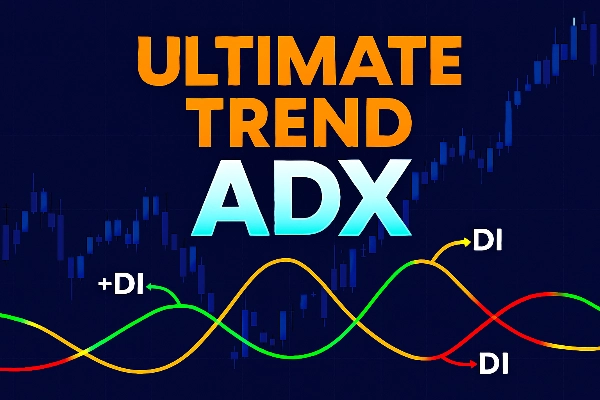
Ligne +DI (Vert) : Représente le mouvement directionnel haussier. Lorsque +DI est au-dessus de –DI, les acheteurs contrôlent le marché.
Ligne –DI (Rouge) : Représente le mouvement directionnel baissier. Lorsque –DI est au-dessus de +DI, les vendeurs dominent le marché.
Lire les signaux est simple :
Lorsque +DI croise au-dessus de –DI et que l'ADX est en hausse, cela suggère une forte tendance haussière.
Lorsque –DI croise au-dessus de +DI et que l'ADX est en hausse, cela signale une forte tendance baissière.
Lorsque l'ADX est en dessous de 20–25, le marché est généralement en range ou manque de direction claire.
L'indicateur inclut également des niveaux horizontaux à 0, 25, 50, 75 et 100 pour vous aider à évaluer rapidement l'intensité de la tendance.
Comment fonctionne l'indicateur
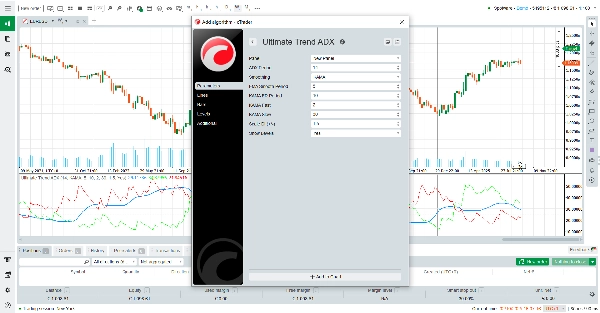
Ultimate Trend ADX est construit sur le système de mouvement directionnel standard mais amélioré avec des algorithmes de lissage modernes :
Moyenne mobile exponentielle (EMA) : Offre une option de lissage rapide et réactive pour les traders souhaitant capter le momentum à court terme.
Moyenne mobile adaptative de Kaufman (KAMA) : S'ajuste dynamiquement à la volatilité du marché, filtrant le bruit lors des phases latérales tout en restant sensible pendant les tendances fortes.
Facteur d'échelle pour +DI et –DI : Amplifie les lignes verte et rouge, rendant les signaux haussiers et baissiers plus visibles et plus faciles à interpréter sur le graphique.
Cette combinaison garantit que l'indicateur s'adapte à différents environnements de marché, vous offrant à la fois clarté et précision.
Caractéristiques clés
Calcul ADX amélioré – Utilise le lissage EMA ou KAMA pour une mesure plus précise et adaptative de la force de la tendance.
Signaux visuels clairs – Codage couleur distinct (bleu/jaune pour ADX, vert pour +DI, rouge pour –DI) rendant l'interprétation intuitive.
Sensibilité ajustable – Les paramètres vous permettent d'affiner la réactivité pour correspondre à votre style de trading.
Niveaux horizontaux intégrés – Les niveaux de référence rapides (0/25/50/75/100) vous aident à évaluer instantanément l'intensité de la tendance.
Pourquoi choisir Ultimate Trend ADX ?
Le succès en trading dépend souvent de la capacité à identifier quand un marché est en tendance et quand il ne l'est pas. Ultimate Trend ADX vous donne cet avantage en combinant la fiabilité de l'ADX classique avec des améliorations modernes qui le rendent plus net, plus clair et plus exploitable. Que vous tradiez le forex, les actions, les indices ou les matières premières, cet indicateur vous aidera à filtrer le bruit, confirmer les signaux et rester aligné avec la direction dominante du marché.
Résumé
This indicator incorporates exponential moving average (EMA) or Kaufman’s adaptive moving average (KAMA) smoothing techniques to improve responsiveness and reduce noise. It also features a scaling factor for the +DI and –DI lines, enhancing signal visibility. Horizontal reference levels at 0, 25, 50, 75, and 100 assist in quickly assessing trend intensity.
Ultimate Trend ADX supports multiple markets including forex, stocks, indices, commodities, and cryptocurrencies. It is suitable for various trading strategies such as scalping, breakout, and grid trading. Adjustable sensitivity settings allow customization to fit different trading styles. This tool aids traders in identifying strong trends, spotting reversals, and confirming entry signals with improved clarity and precision.
Avis clients
5 | 100 % | |
4 | 0 % | |
3 | 0 % | |
2 | 0 % | |
1 | 0 % |